

Getting Started with Workspace ONE Experience Management
Overview
Introduction
Digital Employee Experience, or DEX, is the sum of all an employee’s interactions with technology and tools they use at work. These interactions directly impact employee sentiment and are critical to productivity and engagement in the workplace. And especially as many organizations have shifted to hybrid work, there have been challenges in delivering an optimal experience that result in business disruptions.
In order to ensure high-quality experiences that empower employees to do their best work, a comprehensive DEX solution is required that enables organizations to deliver engaging experiences across the employee lifecycle, measure the experiences employees have with the technology they use, maintain consistent visibility across the deployment to analyze issues that impact experience and productivity and remediate issues that cause disruptions.
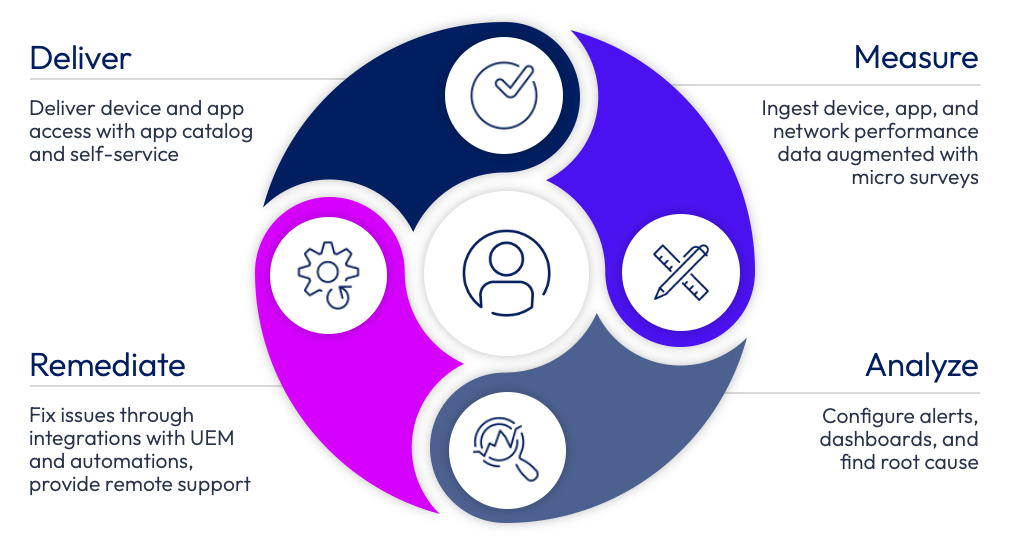
Figure 1: Components of a comprehensive Digital Employee Experience (DEX) solution
The Omnissa DEX solution provides the necessary tools to deliver an optimized employee experience to the end user including any app on any device, self-service resources, and any support required. This end-user experience is delivered by combining Workspace ONE Intelligent Hub, Hub Services, UEM, Horizon, and Omnissa Access.
Experience Management, which is built on top of the Omnissa Intelligence analytics platform, enables IT to monitor device performance, connectivity, app performance, and tools to gather user sentiment and combine this data to measure the success of the employee experience delivery. Telemetry collected from the deployment is automatically analyzed in order to surface anomalies and maintain a quality employee experience, powered by data science.
The Omnissa DEX solution also enables IT to provide many methods to remediate issues, whether automated remediation using Experience Management within Omnissa Intelligence, real-time remote support using Workspace ONE Assist, or employee self-service tools within Intelligent Hub. The help desk can also utilize Experience Management tools within Intelligence to perform manual or guided root cause analysis, powered by machine learning.
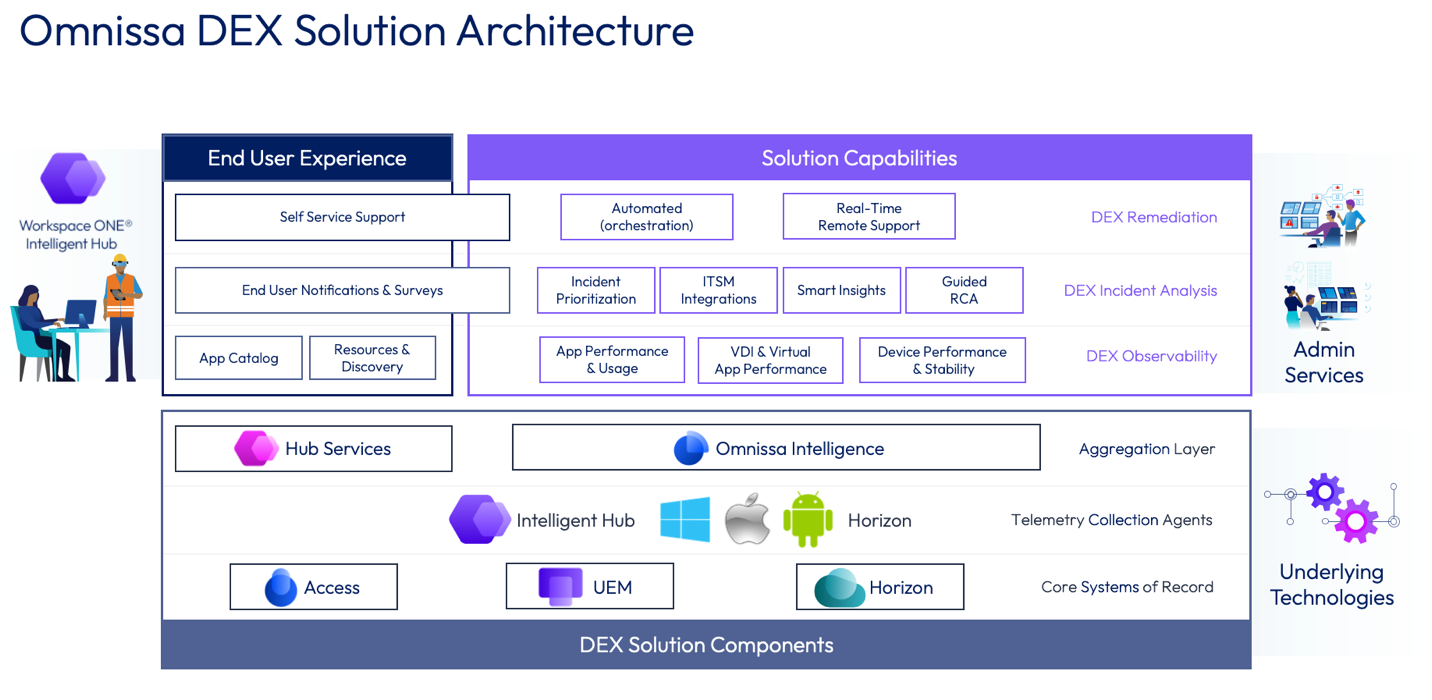
Experience Management, powered by Omnissa Intelligence, provides the bulk of the DEX solution, including measuring employee experience, analyzing the environment, and providing automated remediation.
Purpose of this tutorial
This document provides a technical overview of the Experience Management toolset within Omnissa Intelligence and covers example use cases. For more information on the Omnissa DEX solution, see the DEX Solution page on Tech Zone.
Audience
This guide is intended for IT administrators and product evaluators who are familiar with Workspace ONE Unified Endpoint Management (UEM), Omnissa Intelligence, and Horizon. Familiarity with Windows, macOS, and Linux operating systems, mobile applications, identity management, virtual desktops, and directory services is assumed. Knowledge of other technologies, such as Omnissa Access, is also helpful.
Experience Management basics
First, what is Intelligence?
Omnissa Intelligence is the data platform that aggregates telemetry from your entire Workspace ONE and Horizon deployments and correlates that data to surface insights, make recommendations, and provide visibility across your deployment.
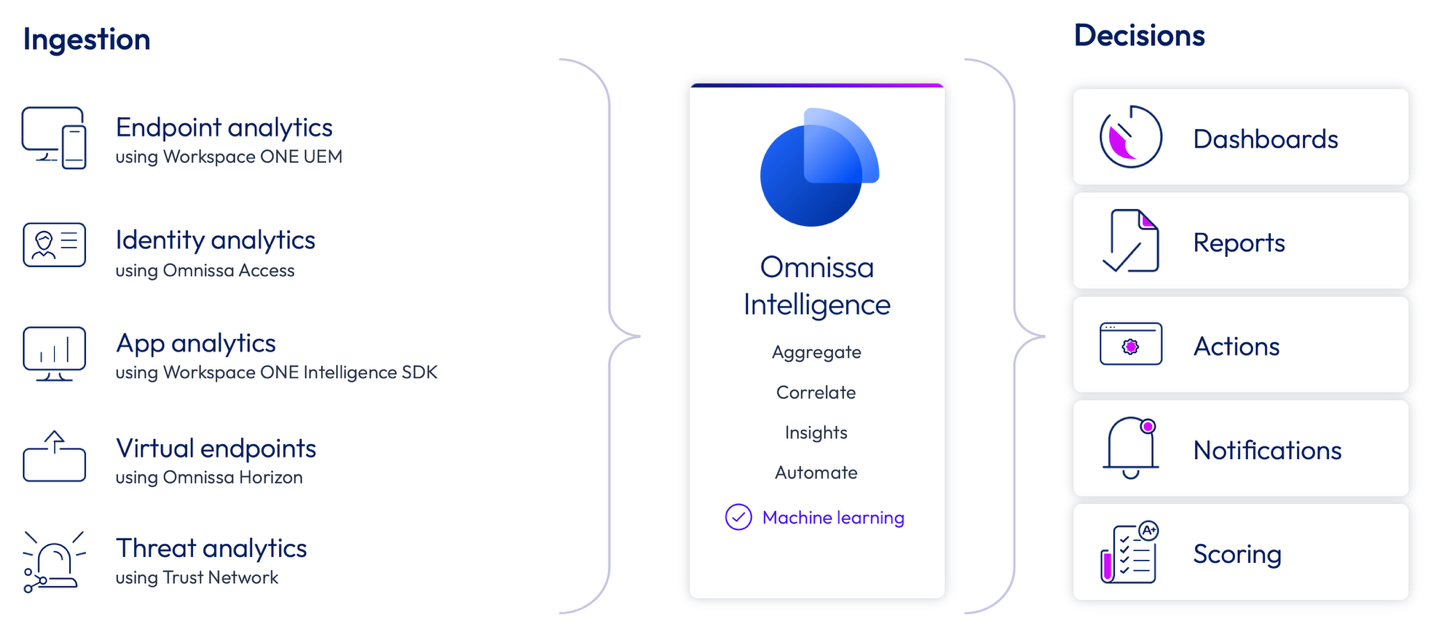
Figure 3: Data sources that feed Omnissa Intelligence and example outputs
Telemetry from your UEM, Horizon, and Omnissa Access deployments and other external sources is fed into the Intelligence data lake, then analysis and automation can take place. So think of Omnissa Intelligence as a data platform, and solutions are built on top to achieve business outcomes, such as proactive support and maintenance made possible by alerting, root cause analysis, automated remediation and security, and user experience scoring and analytics. Experience Management is one of the tools built on top of Omnissa Intelligence that uses collected telemetry data to deliver, measure, analyze, and remediate the end user’s experience with technology.
Check out these resources on Tech Zone to learn more about Omnissa Intelligence:
Getting Started with Omnissa Intelligence
Omnissa Intelligence Architecture
Mobile Device Use Cases for Omnissa Intelligence
Automating Device Lifecycle Management with Omnissa Intelligence
Experience Management overview
Experience Management empowers administrators to track cross-platform key performance indicators, or KPIs, that impact employee experience – such as tracking OS crashes, application load times, battery performance issues, and many more – and use this data to generate an employee experience score. Then this quantitative data can be correlated with user sentiment data made possible by surveys built into Workspace ONE to provide a comprehensive picture of employee experience.
IT admins can also use Experience Management to perform guided or manual root cause analysis (RCA) and automate remediation workflows to prevent issues in the future. Experience Management accelerates RCA since the data is already collected. Often there is no need to bother the end user and collect logs manually.
In addition, Experience Management surfaces anomalies, called Insights, using machine learning to help proactively prioritize the most impactful incidents without waiting for employees to submit tickets or collecting and correlating numerous support tickets to find common issues. Then, the powerful Freestyle Orchestrator no-code/low-code, drag-and-drop UI can be leveraged to develop workflows to automatically fix common issues, proactively notify specific groups of users, and integrate with third-party IT tools.
Experience Management provides the continuous feedback cycle required to increase employee productivity, deliver an exceptional employee experience and enable proactive IT.
How does it work?
Clients on devices and the Intelligence SDK built into mobile apps provides telemetry to monitor app and device performance. In addition, employee sentiment can be collected via surveys created in Omnissa Intelligence and delivered to users via Workspace ONE Intelligent Hub. This data is fed into pre-built and custom reports and dashboards for admin analysis. Machine learning is utilized to learn expected upper and lower thresholds of device and app data over time and surface anomalies. Guided root cause analysis provides recommendations for actions, and the Freestyle Orchestrator automation engine enables workflows for common resolutions.
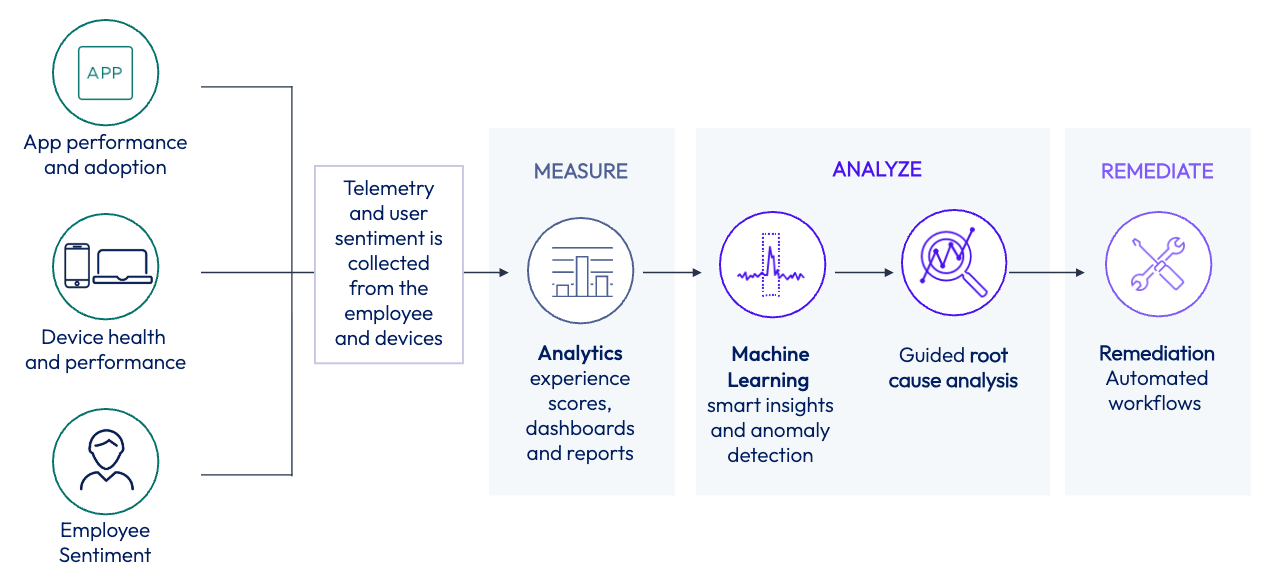
Figure 4: Experience Management collects telemetry from devices and end-user sentiment to enable measuring, analyzing, and remediating
Prerequisites
To collect Experience telemetry from an endpoint, Windows devices must be either fully enrolled in Workspace ONE UEM or in Hub Registered mode. Workspace ONE UEM 2010 or later is required, although, the latest is preferred. macOS devices require full UEM management since Hub Registered mode is not an option. All endpoints must be identified as corporate-dedicated or corporate-shared in UEM to collect telemetry as Experience Management does not collect telemetry from employee-owned devices.
Workspace ONE Intelligent Hub is required on all devices to collect experience telemetry. For Windows devices, Hub 20.10 or later is required (latest preferred). The Experience Management agent is packaged into the Windows Intelligent Hub.
For macOS, Intelligent Hub 21.07 or later is required (latest preferred). However, the Workspace ONE Digital Experience app is also required on macOS to collect experience telemetry. The Experience Management agent is not built into Workspace ONE Intelligent Hub for macOS.
Please note that there is a separate DEX agent for Windows and MacOS that can downloaded and updated manually if preferred, these can be found here: Workspace ONE Experience Management Download.
To collect telemetry from mobile devices and applications, the device must have an app installed with the Omnissa Intelligence SDK embedded. Intelligent Hub and Workspace ONE Productivity Apps, such as Boxer and Android Launcher, include the Intelligence SDK by default. However, internal app developers can leverage the Intelligence SDK to collect analytics from iOS and Android devices and apps.
Finally, the Omnissa Intelligence tenant must be licensed for Experience Management before the option to set up is visible in the console. Contact your Sales representative to understand your current licensing.
Telemetry overview
Once Experience Management is enabled in the Omnissa Intelligence console, agents on devices begin to collect additional telemetry from devices and apps and transmit the data to Intelligence. See the Experience Management Data Definitions documentation for more details.
Depending on the type, telemetry from devices and apps could be sent immediately to Omnissa Intelligence or batched and sent in fixed intervals. For example, resource consumption and device performance telemetry is sent every five minutes, and network statistics are sent every ten minutes. On the other hand, the following data is sent immediately: app crash, app hang, app foreground, device OS crash, device boot, device shutdown, and patch install.
Please note when navigating through most features inside Experience Management, the features often overlap in usability between desktop, mobile, and Horizon. The screenshots used in this guide will primarily feature desktop endpoints, but will function the same when applicable to mobile and Horizon. If a feature is used differently for various platforms, then it will be called out accordingly.
How to enable within Omnissa Intelligence
To locate Experience Management within Omnissa Intelligence, navigate to the Marketplace, then Solutions. From this landing page, you can explore Experience Management documents, videos, and other resources. This is also where Experience Management options are enabled.
The Experience Management landing page will list four options:
- Desktop Devices & Apps –Experience Management for Windows and macOS devices and apps
- Mobile Device & Apps – Experience Management for iOS and Android devices and apps
- Virtual Desktop & Apps – Experience Management for Horizon virtual desktops and apps
- Frontline Workers – Out-of-the-box templates for Frontline use cases
For example, to enable Experience Management for desktop devices and apps, click SET UP. Next, click GET STARTED to move forward and then CONFIRM to acknowledge connected services.
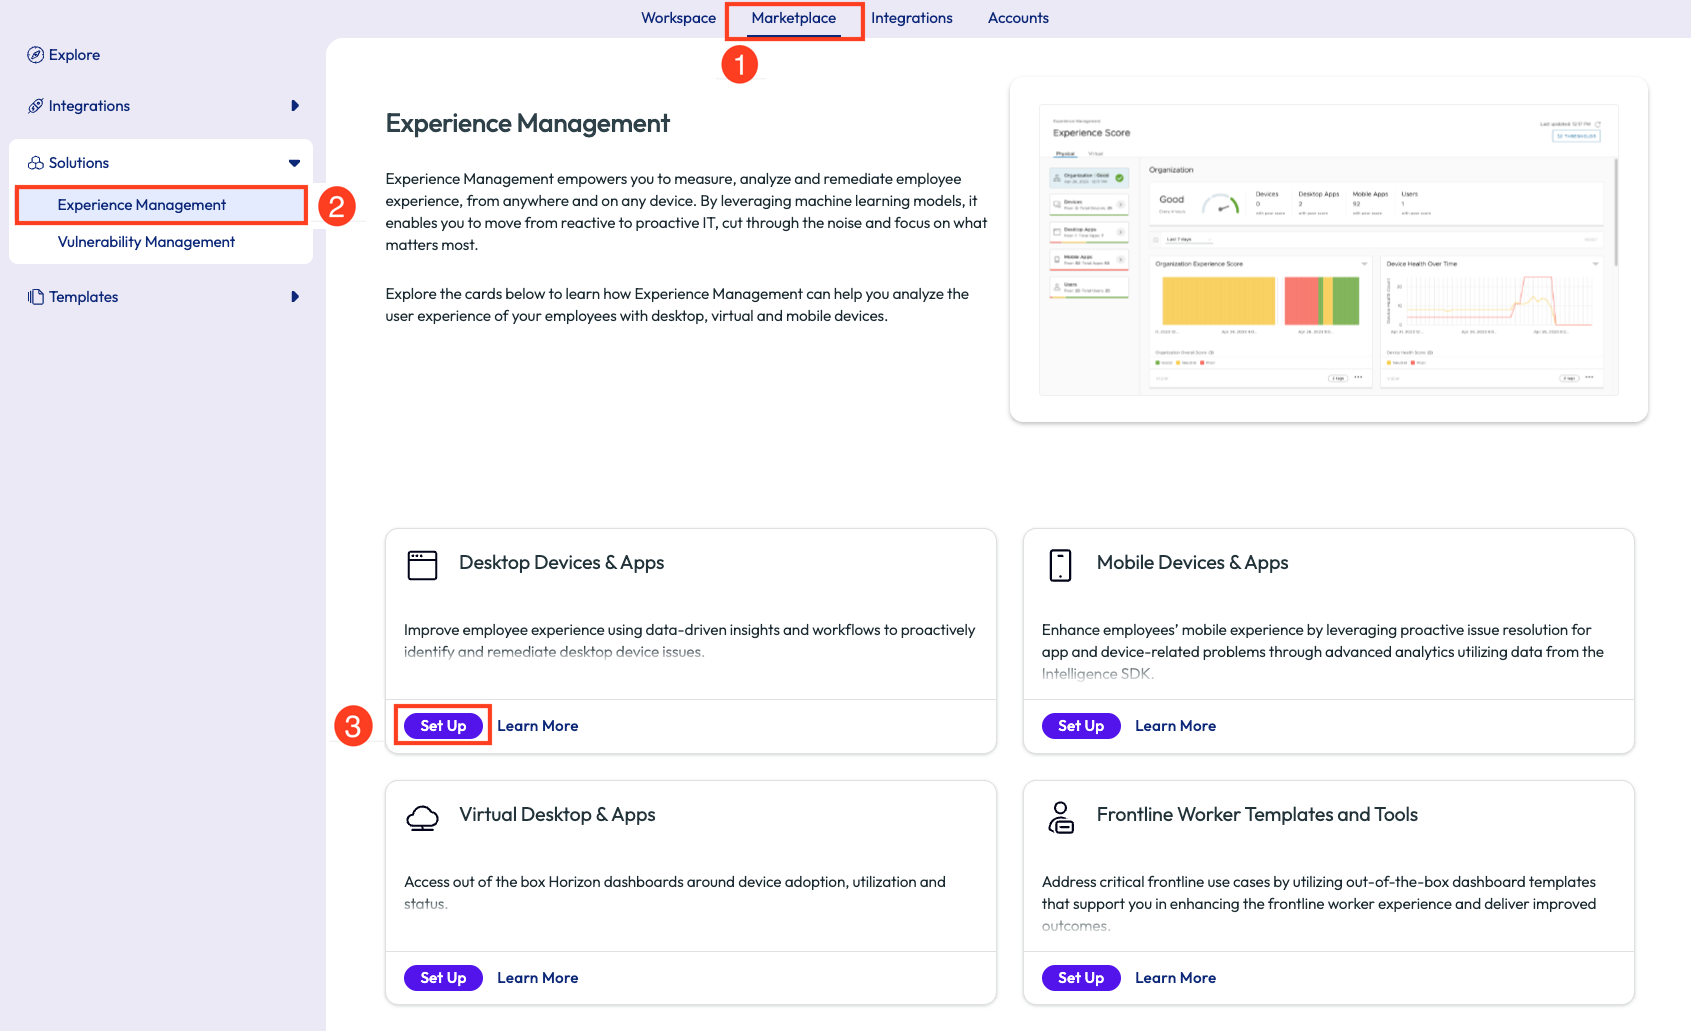
Figure 5: Where to find the Experience Management solution within Omnissa Intelligence and click SET UP
Next, verify the Workspace ONE UEM connection status is authorized, and click NEXT. This verification allows Intelligence to ingest data from UEM.
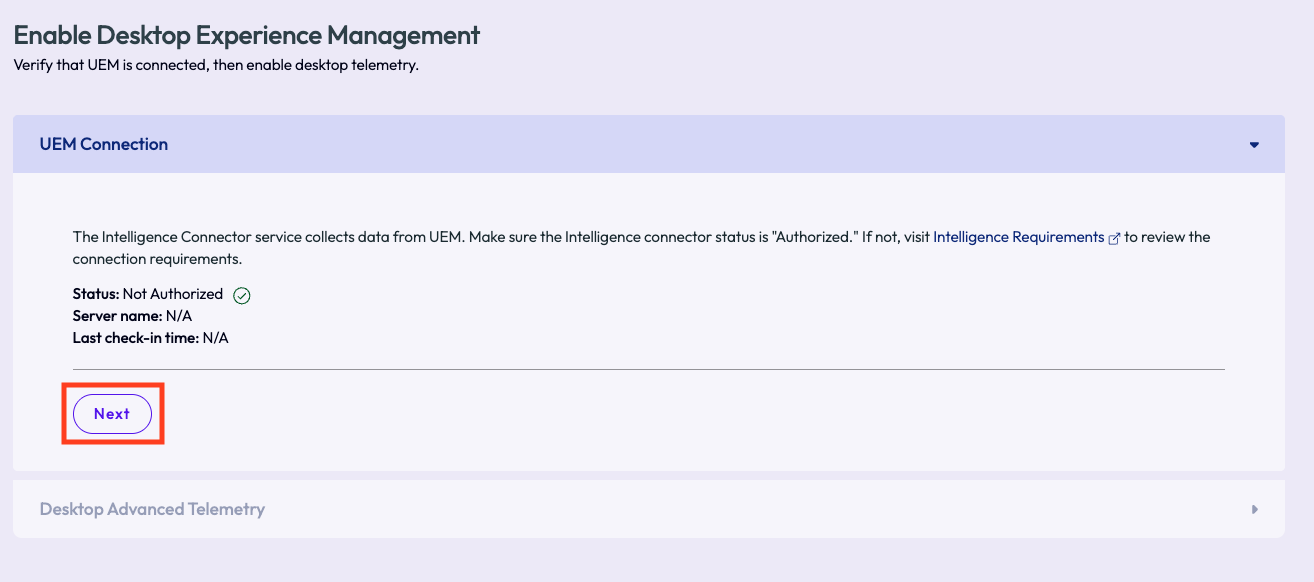
Figure 6: Click NEXT after verifying the status of the Workspace ONE UEM Connection
Finally, click ENABLE to enable Desktop Advanced Telemetry. This step enables Experience Management telemetry collection from enrolled Windows and macOS devices.
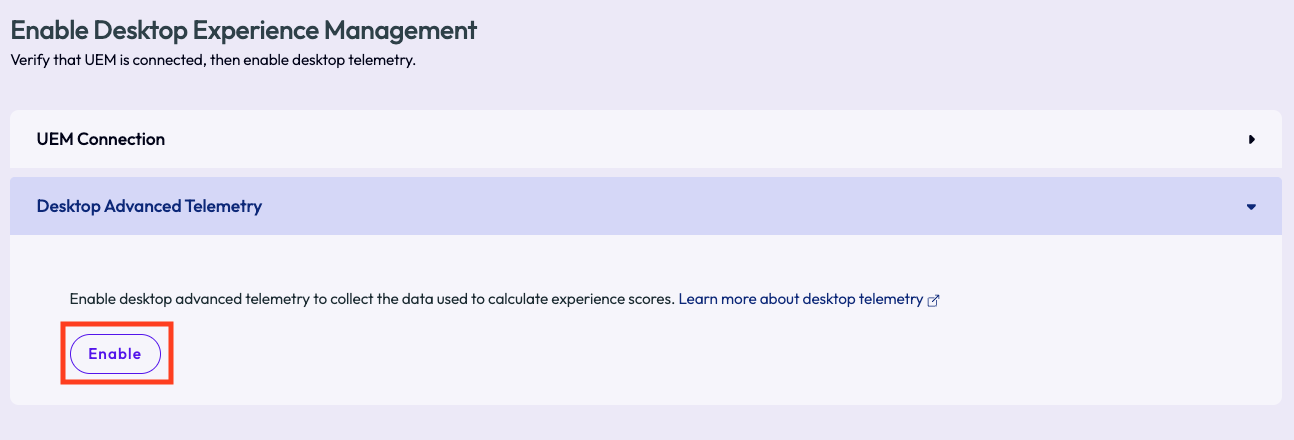
Figure 7: Enable Desktop Advanced Telemetry to complete setup of Experience Management for desktop devices and apps
Follow similar steps to enable Experience Management for mobile devices and apps, Horizon virtual desktops and apps, and the Frontline Worker templates and tools.
Note that the Omnissa Intelligence SDK is required within a mobile app to collect telemetry. The Workspace ONE Intelligent Hub and Productivity Apps, such as Boxer, Content, and Android Launcher, have the Intelligence SDK built in by default. However, developers of custom-built apps will need to include the Intelligence SDK. See Omnissa Intelligence SDK documentation to learn more.
Once enabled, Experience Management options will show as Enabled on the Marketplace landing page.
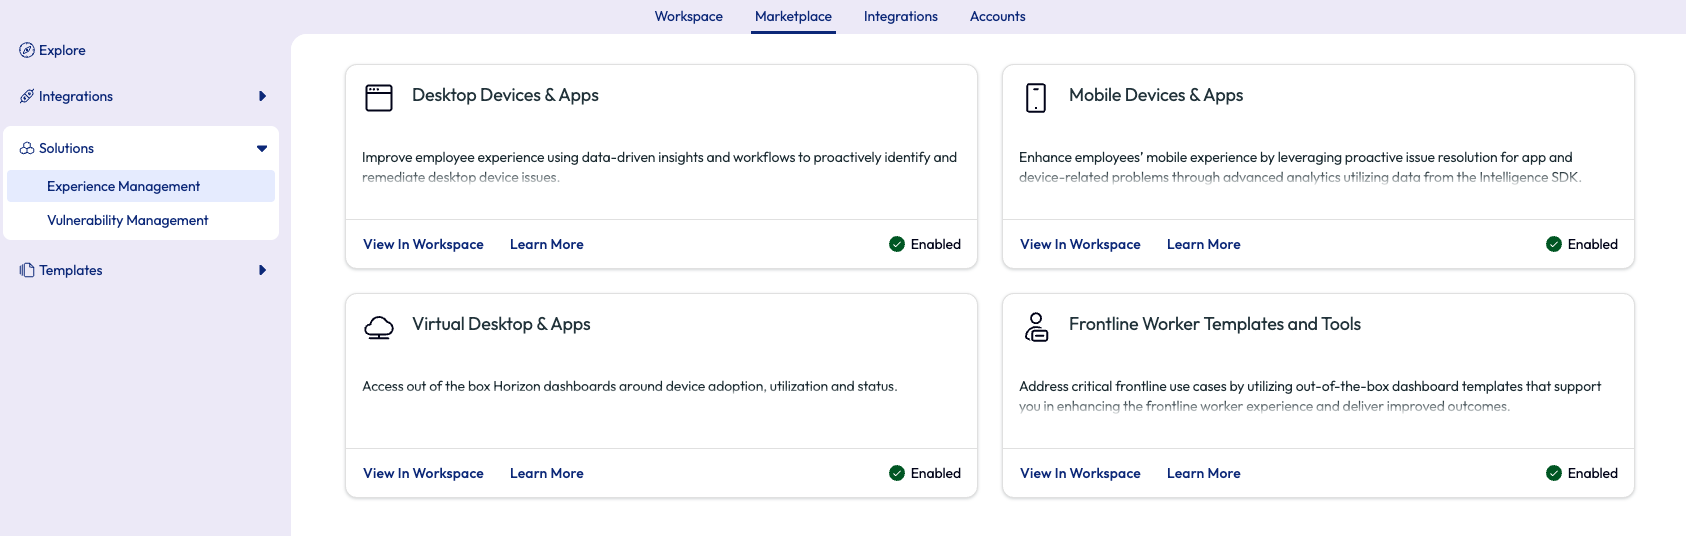
Figure 8: All Experience Management options are enabled
If Omnissa Intelligence is not licensed for Experience Management, the cards will show buttons to CONTACT SALES instead of SET UP. Contact your sales rep to obtain licensing for Experience Management.
After Experience Management is enabled, you can find the tools under Workspace, then Experience Management. Note that it can take at least four hours for the Experience Score dashboards to populate once Experience Management has been enabled in the console.
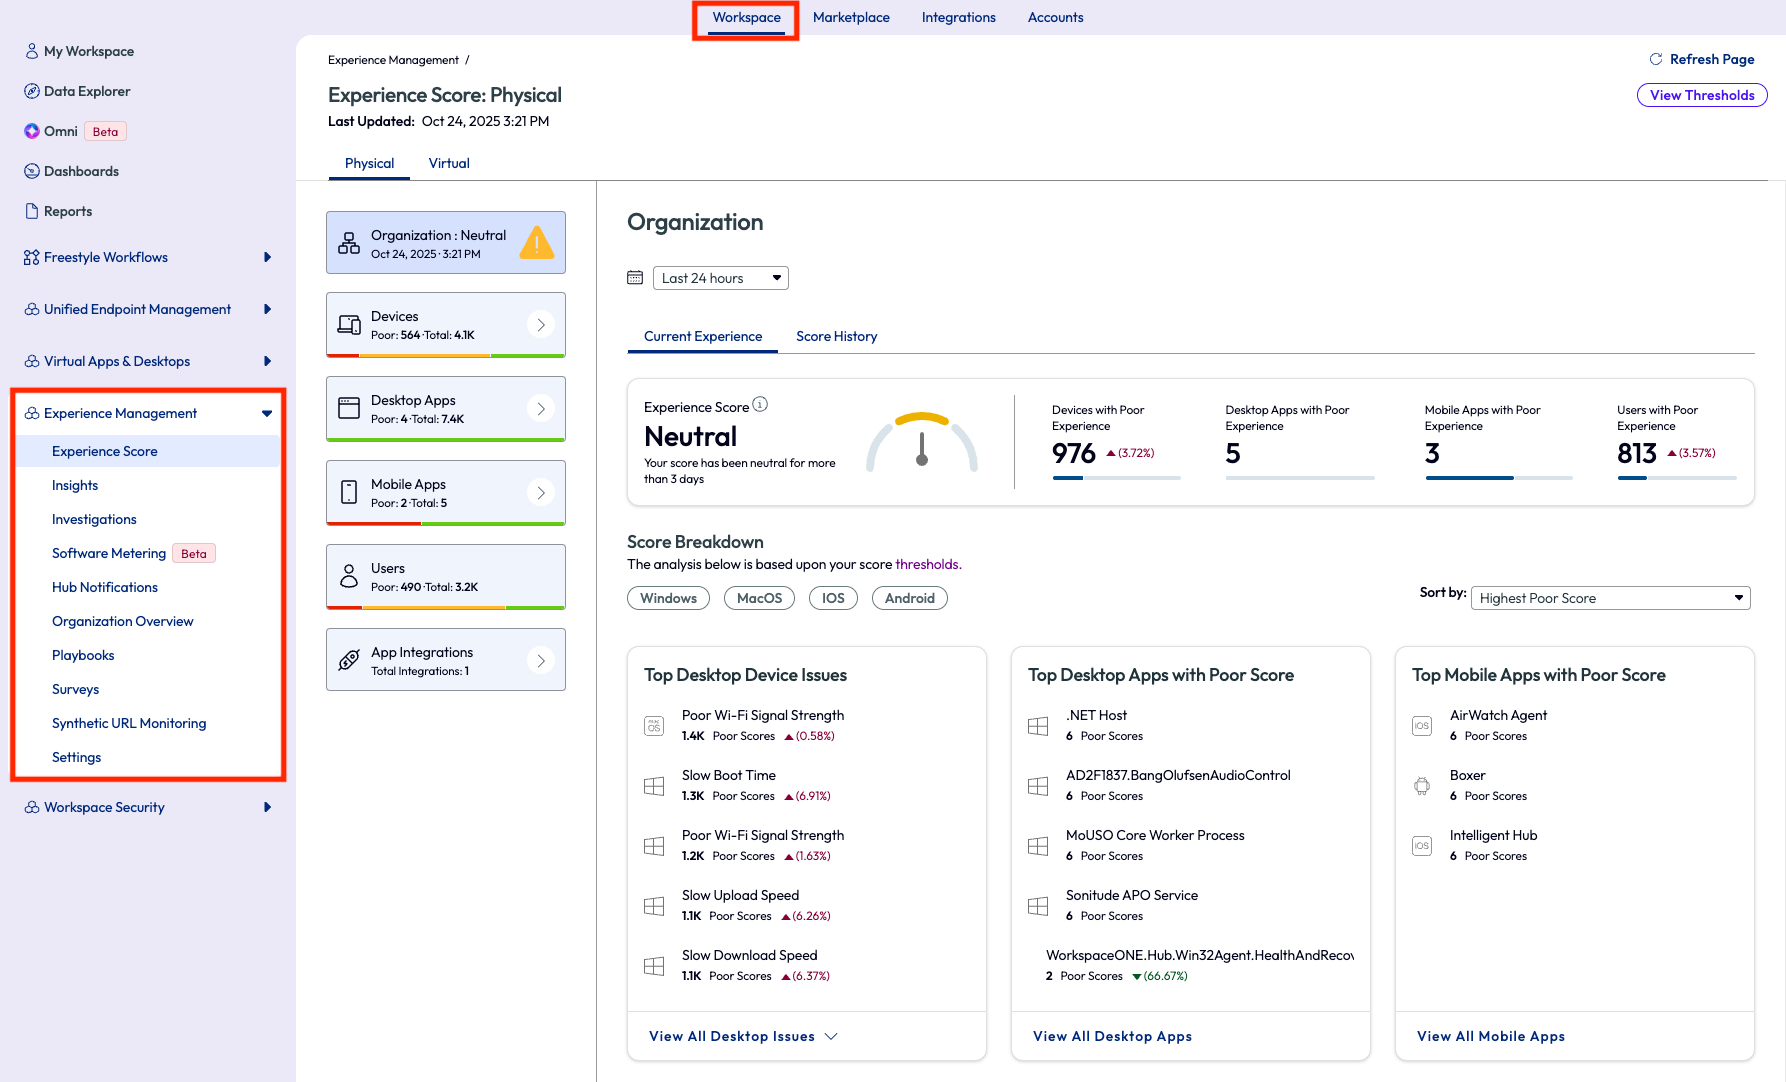
Figure 9: Where to find Experience Management tools once the solution is enabled
Experience Management tools
The following is an overview of the tools available within Experience Management.
Templates
Even though the Workspace ONE platform provides the ability to create custom dashboards, reports, scripts, workflows, and sensors from scratch, sometimes you need to just get up and running quickly with a common use case. This is why a library of templates is provided within the Omnissa Marketplace to help get you from raw data to value quickly, without taking the time to build these components from scratch.
To access the templates, select the Marketplace tab at the top of the Intelligence console, then expand the Templates menu in the left navigation. Then filter the templates by use case, platform, or other filters at the top of the list.
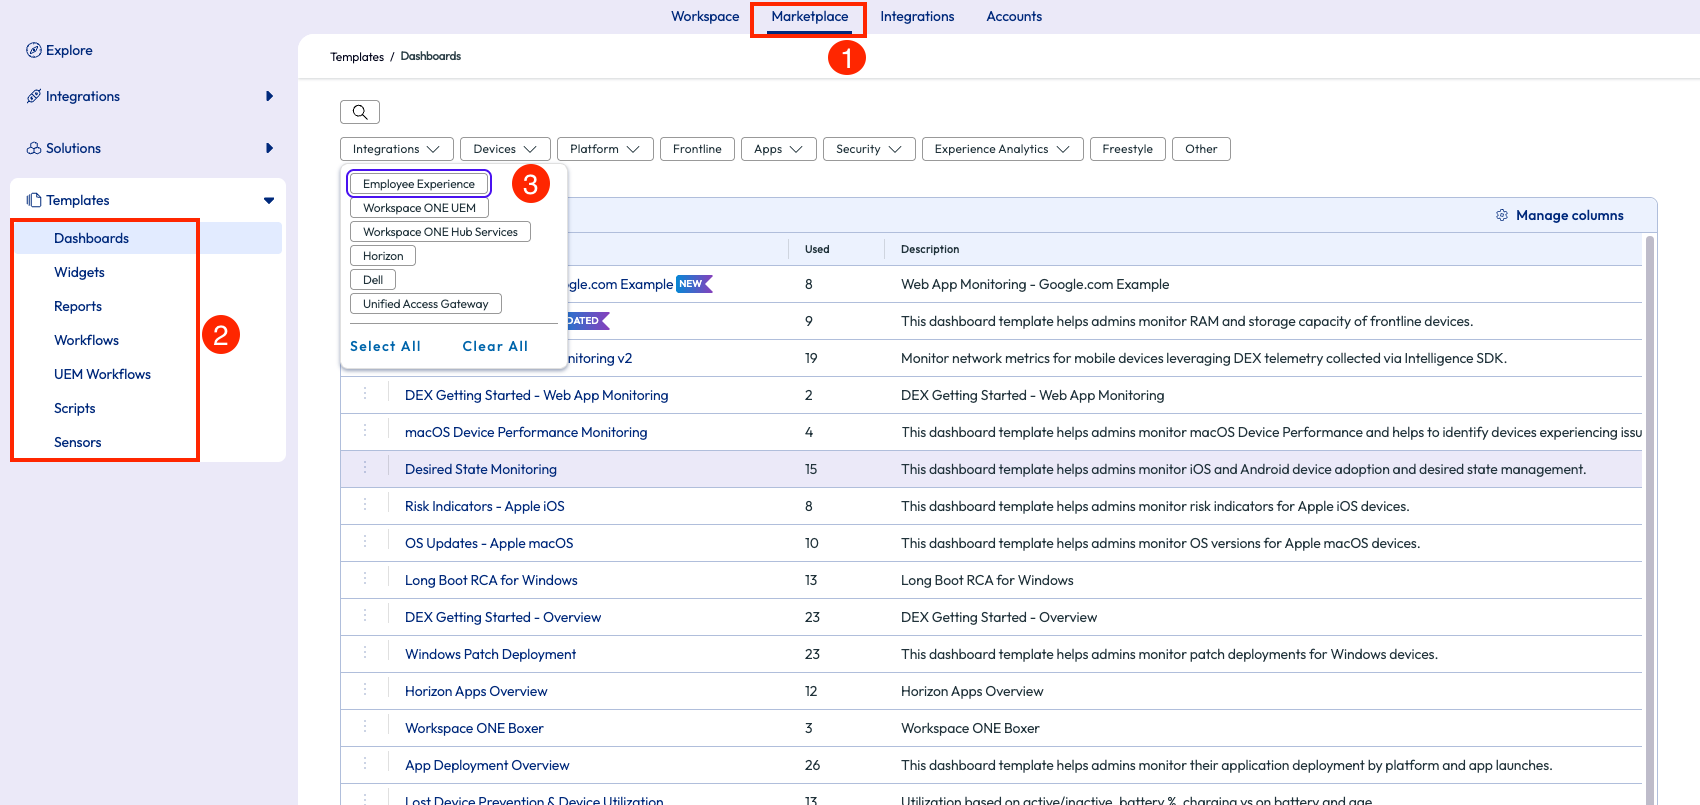
Figure 10: Where to find and filter templates in Omnissa Intelligence
Then click the name of the template to view details and add it to your personal Intelligence workspace.
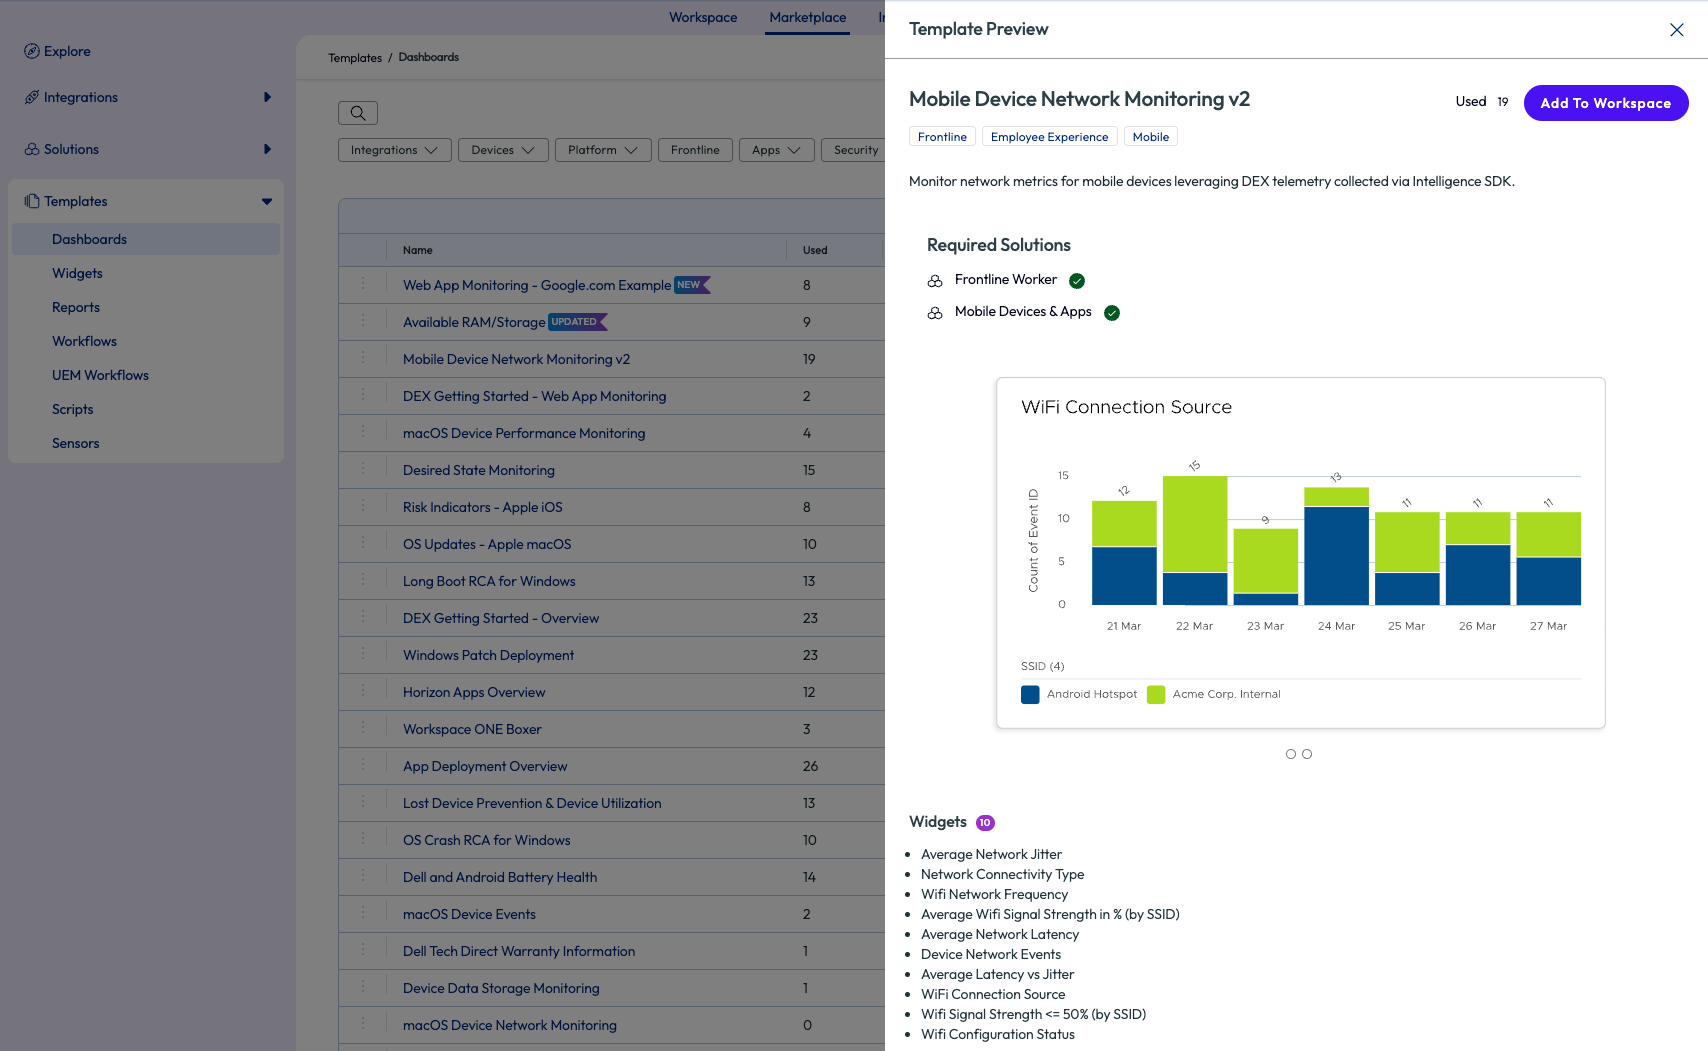
Figure 11: View dashboard template details and add to your workspace
For example, there are many dashboard templates for Experience Management use cases, such as performance monitoring by platform and available RAM/storage. In addition, many Frontline dashboard templates are provided, such as shared (check-in/check-out) device metrics, Zebra device battery health, and tracking potentially lost devices - and more templates are added to the library over time.
In addition to dashboards, templates are available for widgets, reports, automated workflows, scripts and sensors. For example, there are many PowerShell and Bash scripts available for common tasks that can be added to an automated workflow in the Freestyle workflow editor.
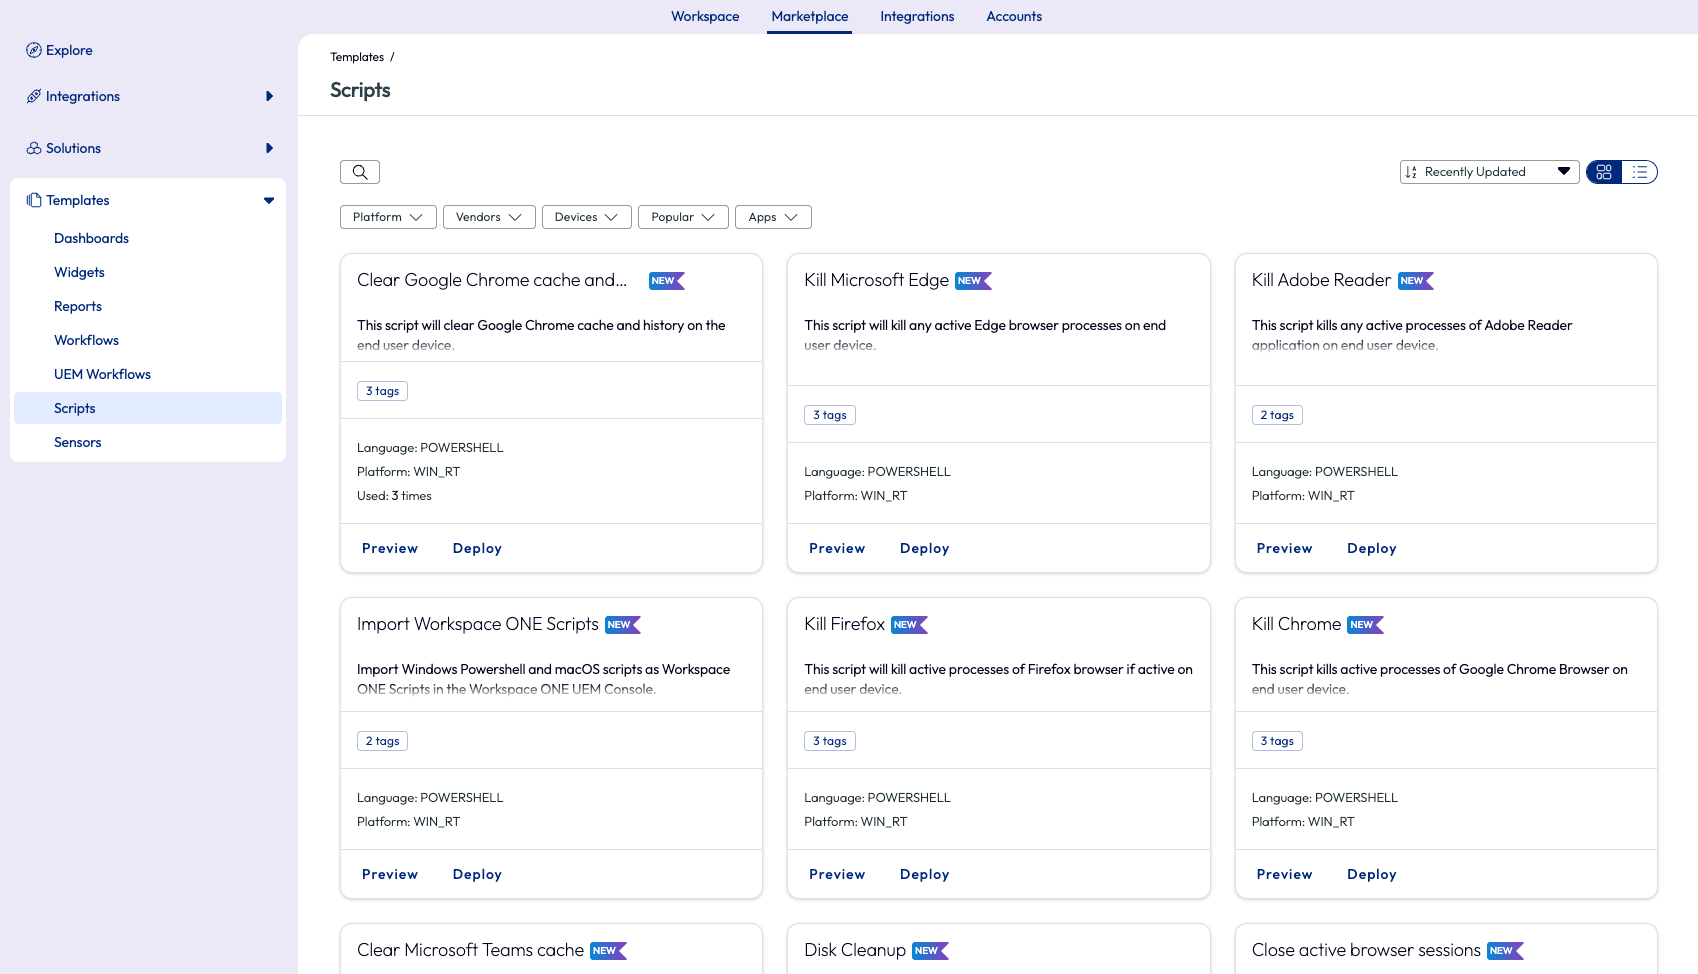
Figure 12: Device script templates in the Omnissa Intelligence Marketplace
Experience Score
The Experience Score is the “Measure” component of the Omnissa DEX solution. Here is where employee digital experience with devices and apps is scored based on several metrics.
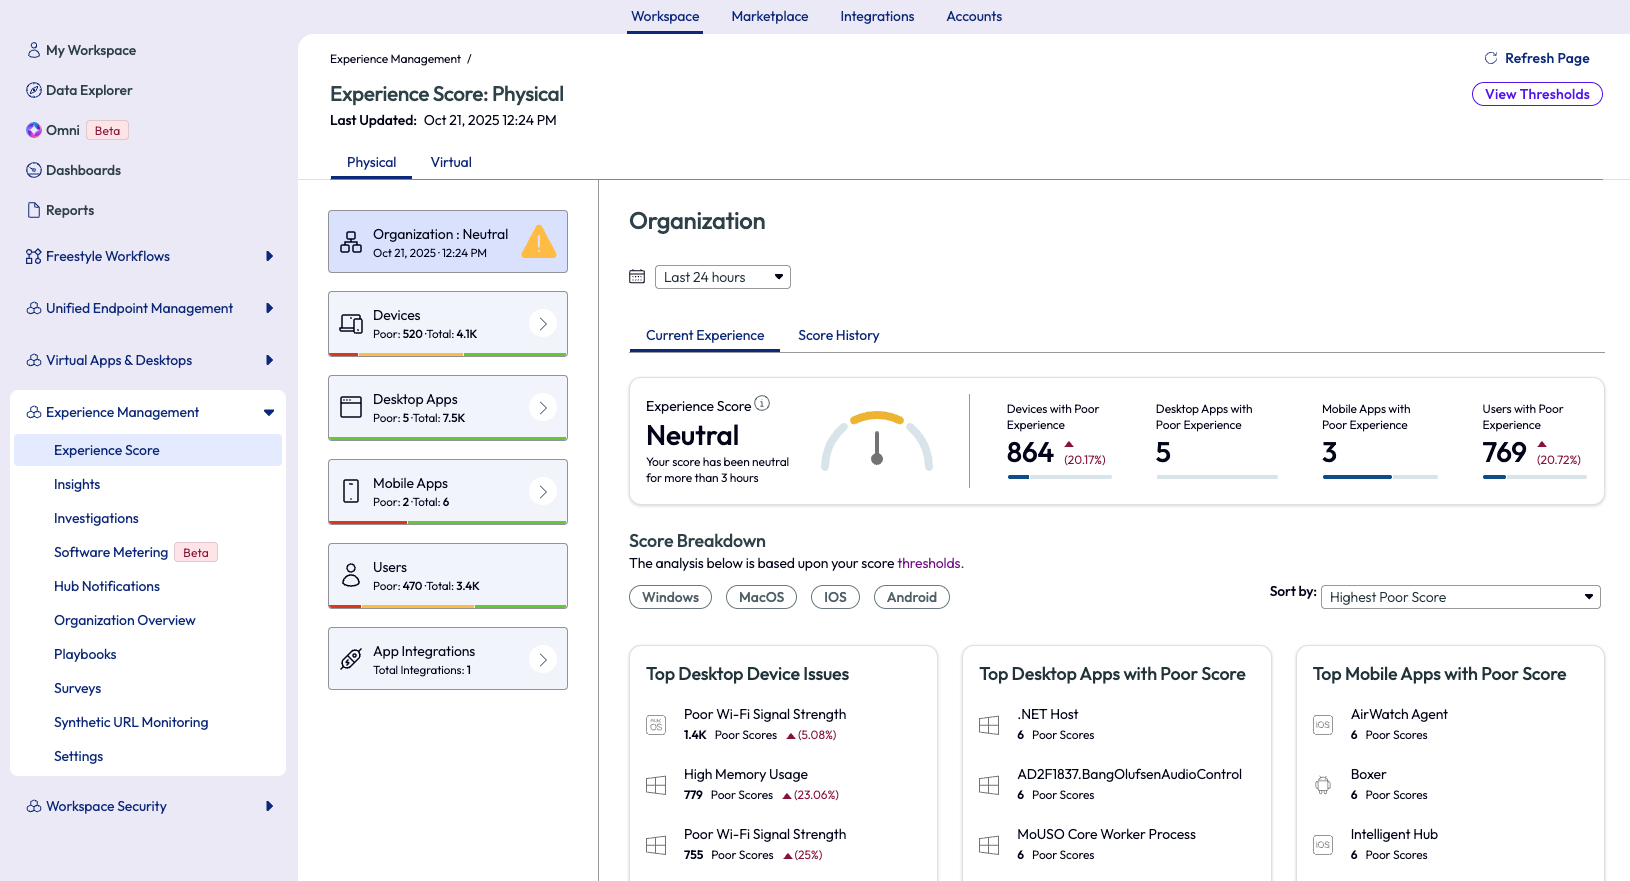
Figure 13: Experience Score dashboards for desktop devices, desktop apps, mobile apps, users, and an overall organization score. Experience Score is also available for Horizon virtual desktops and apps.
To view the metrics used to calculate the scores and adjust the thresholds for your deployment, click the View Thresholds button in the top right of the Experience Score dashboard, or click Settings under Experience Management in the left navigation.
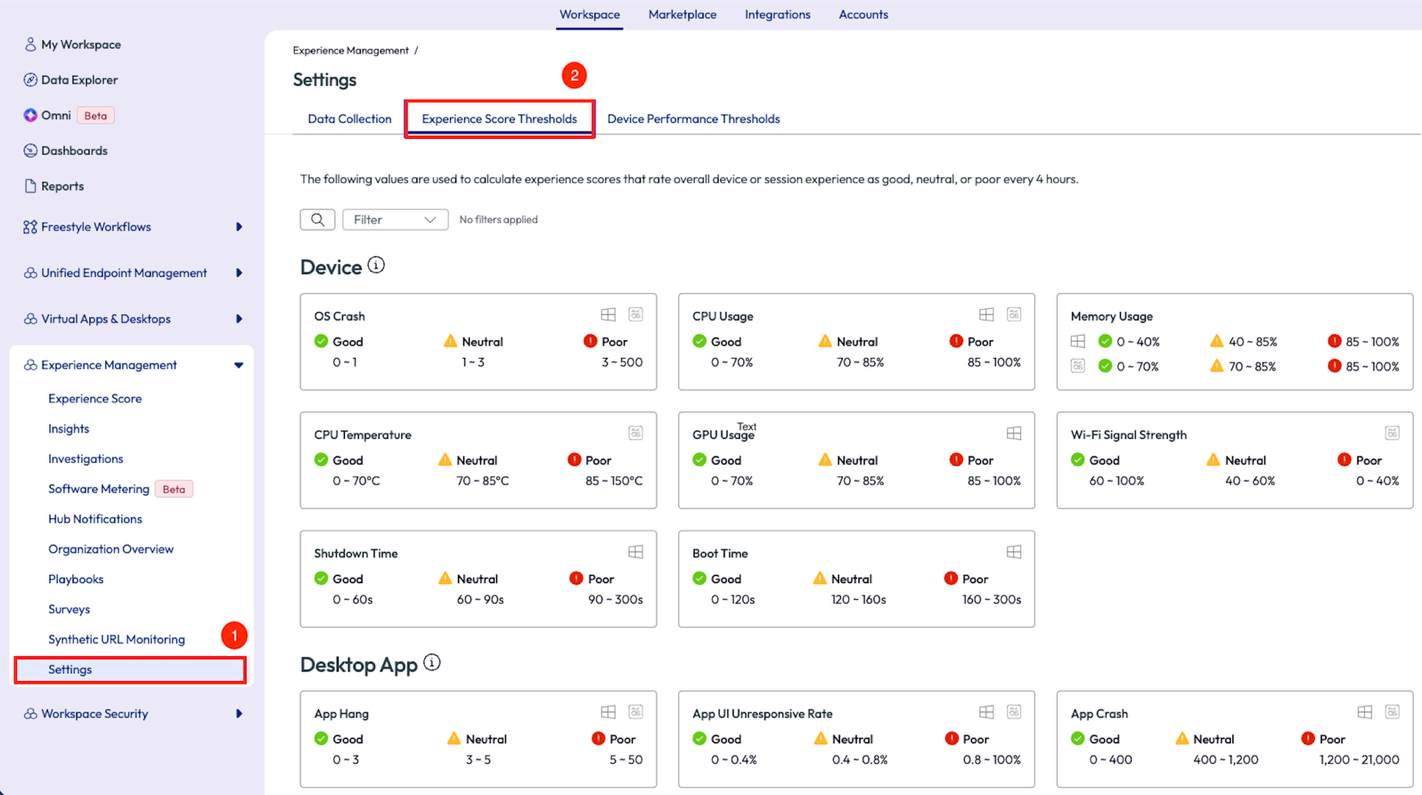
Figure 14: Where to view metrics that compose the Experience Scores and edit default thresholds
Experience Score is broken down by desktop devices, desktop apps, mobile apps, Horizon virtual desktops and apps, and an overall organization score. The admin can also drill down and view the Experience Score for individual apps, devices, and users.
Table 1: Experience Score types and determining metrics
| Experience Score Type | Metric(s) Used |
| Overall Organization Score (across physical and virtual devices and apps) | Determined by percentage of users with a poor Experience Score |
| Overall Desktop Device Score | Based on scores of Windows and macOS devices |
| Windows Device Score | Based on upload speed, battery health, Wi-Fi strength, memory utilization, OS crash count, CPU utilization, shutdown time, GPU utilization, boot time, and download speed |
| macOS Device Score | Based on Wi-Fi strength, memory utilization, OS crash count, CPU utilization, and CPU temperature |
| Overall Desktop App Score | Based on scores of Windows and macOS apps |
| Windows App Score | Based on app hangs, app UI unresponsive rate, app CPU usage, app crash rate, app UI unresponsive duration, app memory usage, app UI unresponsive count, and app GPU usage |
| macOS App Score | Based on app hangs, app UI unresponsive rate, app CPU usage, app crash rate, app UI unresponsive duration, app memory usage, and app UI unresponsive count |
| Mobile App Score (Android and iOS) | Based on network errors, response time, app crash rate, and handled exceptions |
| Virtual Session Score | Based on CPU usage, disk latency, WAN packet loss, protocol latency, logon duration, Wi-Fi signal strength, LAN packet loss, WAN latency, protocol packet loss, LAN latency, disk IOPS and memory usage |
The Experience Score dashboards provide an overall view of the deployment but are also a valuable first step when troubleshooting widespread or individual issues.
For example, the Windows device Experience Score dashboard will display the top contributors to a poor user experience and detailed metrics by OS version. 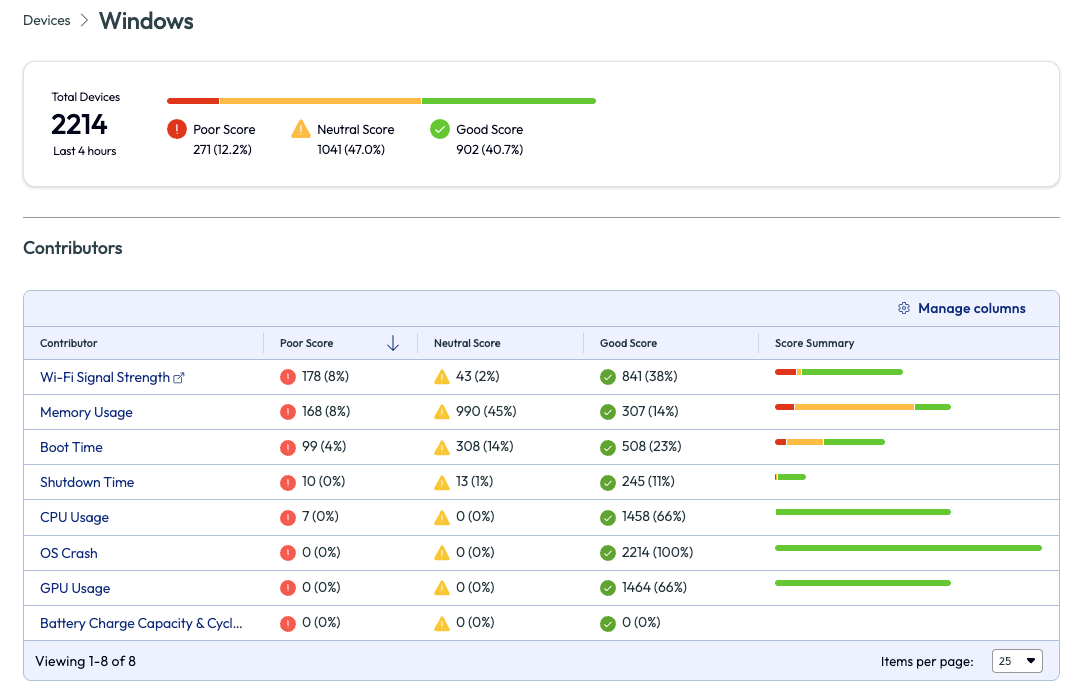
Figure 15: Windows device Experience Score overview and top contributors
Click the contributor name to view the list of devices with a poor score associated with the specific category.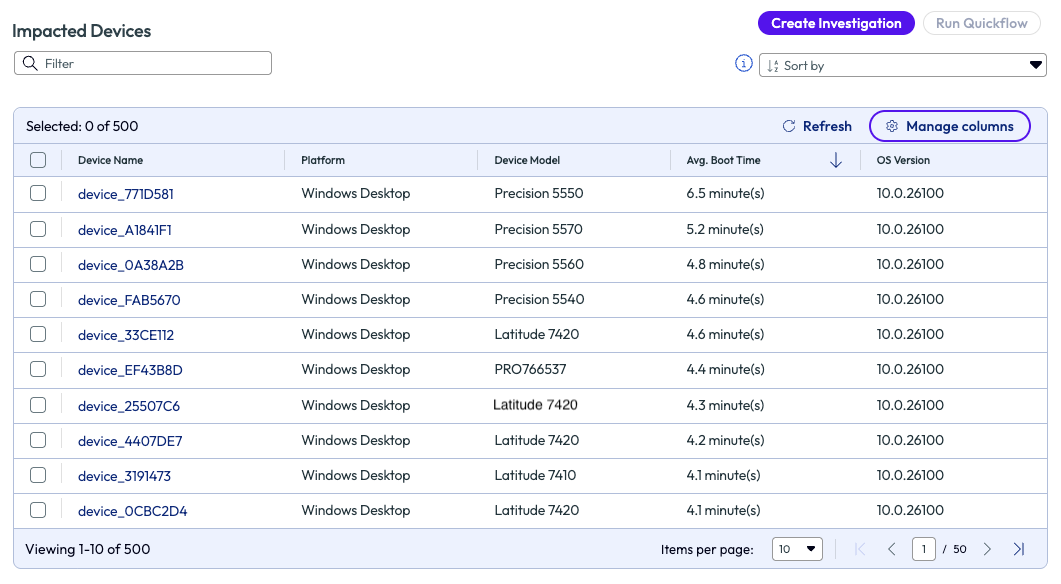
Figure 16: List of Windows devices with the longest boot time
To view the experience score for virtual platforms, simply click the tab for Virtual at the top of the experience score page. Explore the metrics in the left column to see data around the Horizon session, apps used in sessions, management components, and an organizational level view. Using these poor experience contributors can help admins narrow down the root cause of an issue more efficiently and quicker.
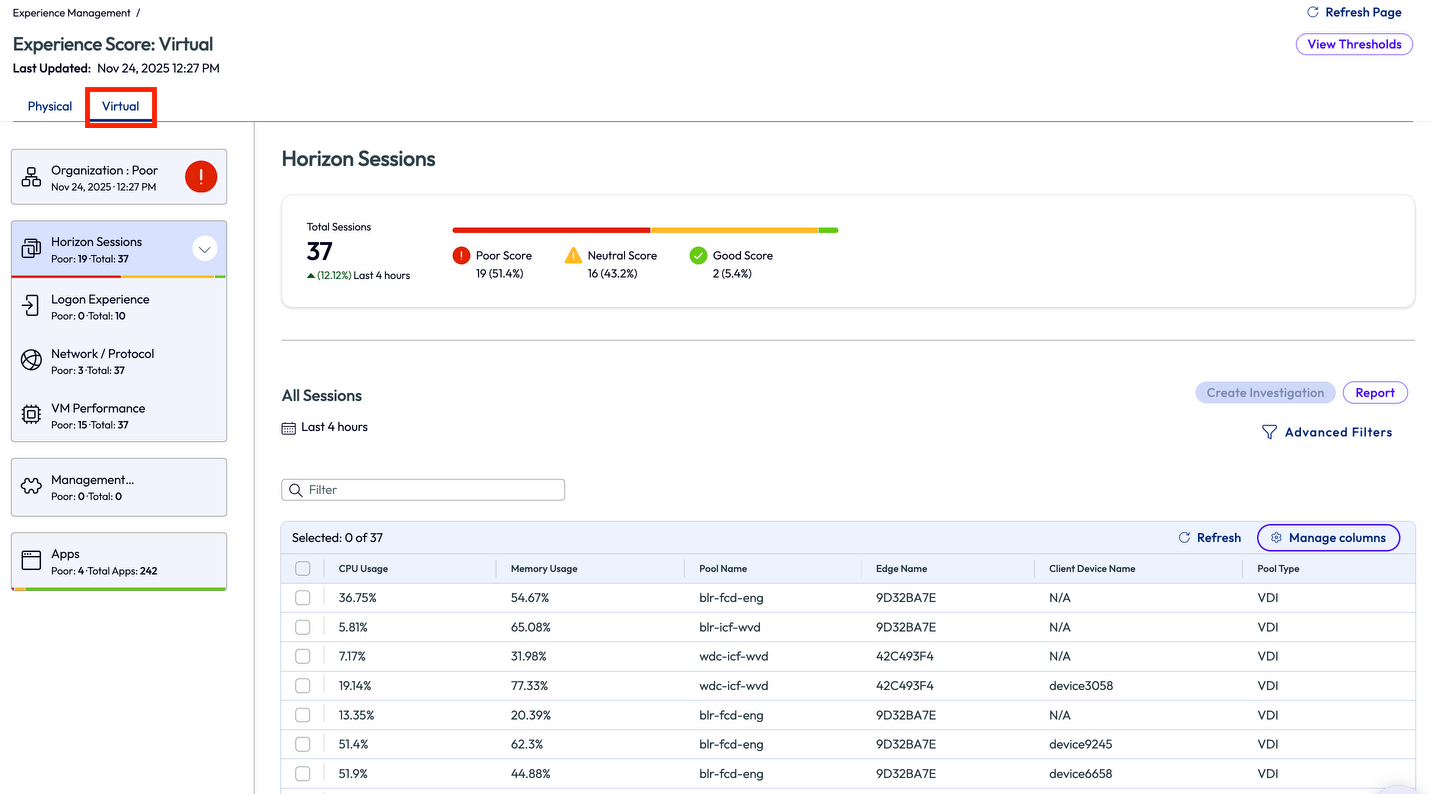
Figure 17: Horizon experience score
Device Timeline & Experience Summary
When viewing a list of devices within Experience Management, click the device name to view details. This device details landing page will show a critical tool: the Device Timeline. When performing root cause analysis, the Device Timeline displays a detailed record of events that led to an issue. Filters are found on the top right of this window to make it even easier to narrow down focus. This view can show very granular events, even under a per-1-second basis by using the zoom tools on the top left. When using the time selector and intervals, note that setting to 4-hour will be real-time. Click the Edit Metrics button on the left to explore and select the exact metrics you need to target or remove nonessential metrics from view.
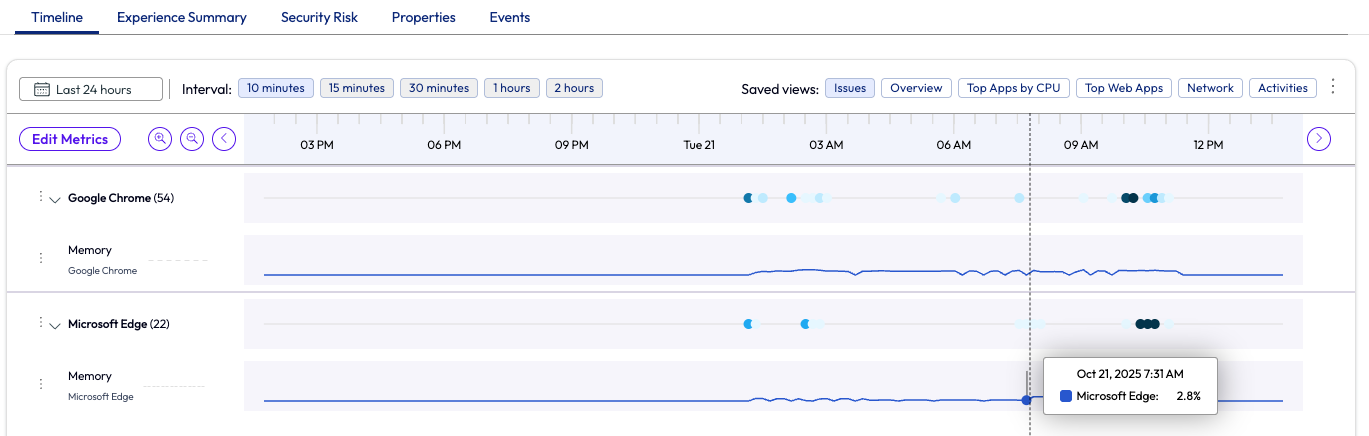
Figure 18: Highlighted events displayed on a timeline for a device
Click on the Experience Summary tab to see more details about the different contributors to a device’s experience score. Also, the breakdown of the device Experience Score is listed and color coded for easy visual consumption. Scroll down further in the Experience Summary tab for more details and insights.
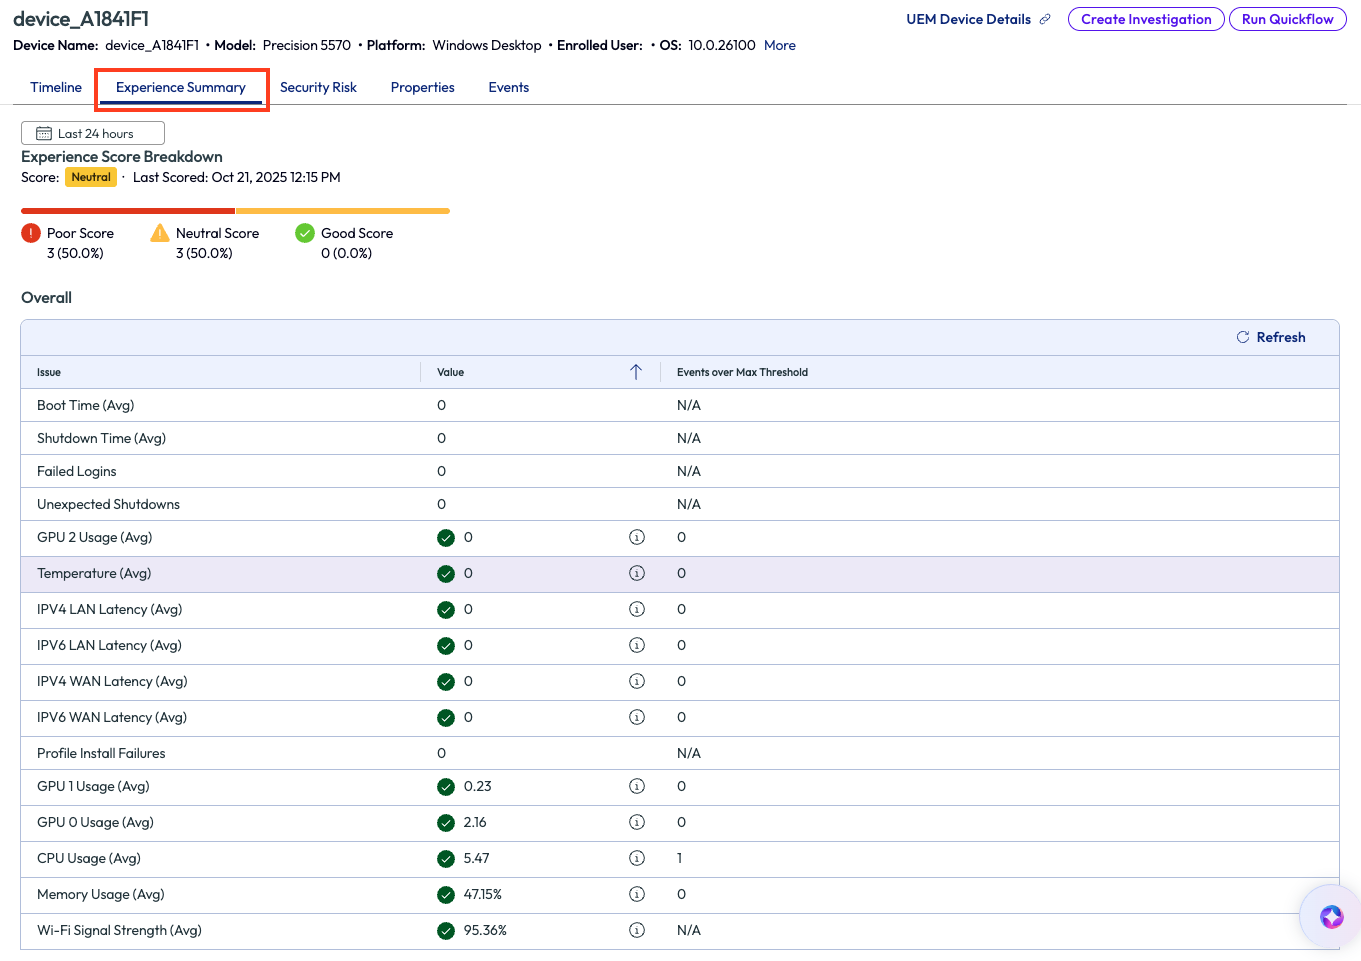
Figure 19: Experience Summary tab for a device in Experience Management
Insights
Experience Management also utilizes machine learning algorithms to surface any anomalies in the deployment and presents these alerts as Insights in the console. The system learns the expected, or baseline, upper and lower thresholds for a metric, adjusting for seasonality – such as OS crashes, app crashes or CPU utilization – and monitors changes over time, so the admin does not have to constantly watch dashboards.
There are four Insight types available: devices, apps, users, and virtual. Use the filtering options at the top of the Insights page to explore or narrow down results.
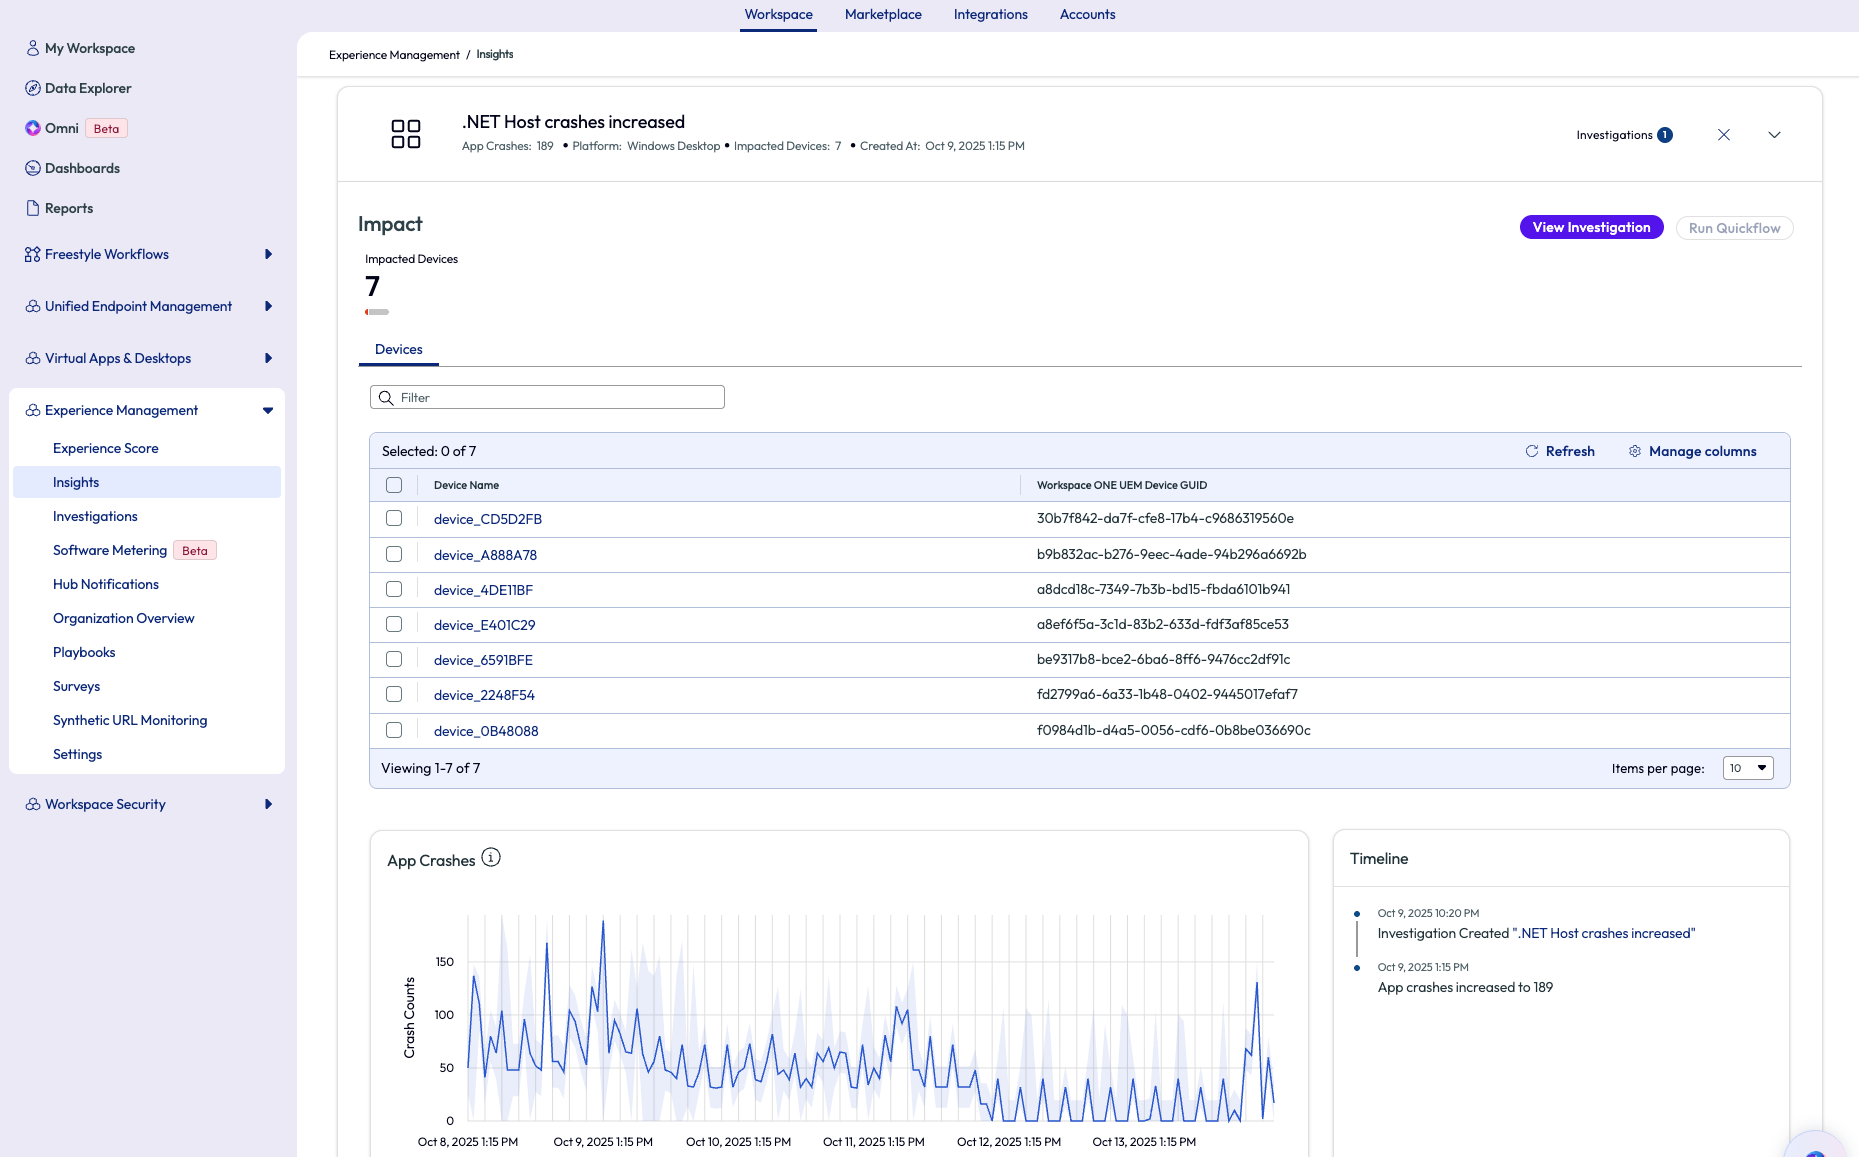
Figure 20: Insight detail within Experience Management
To learn more about Insights and see a complete list of data points monitored, review the Experience Management documentation.
Investigations
After validating whether an Insight is significant enough to investigate, the admin can create an Investigation to:
- Select and view playbooks to resolve the issue
- Track resolution progress
- Collaborate with colleagues
- Perform root cause analysis (RCA)
- Gather contextual information and create custom dashboards related to the incident
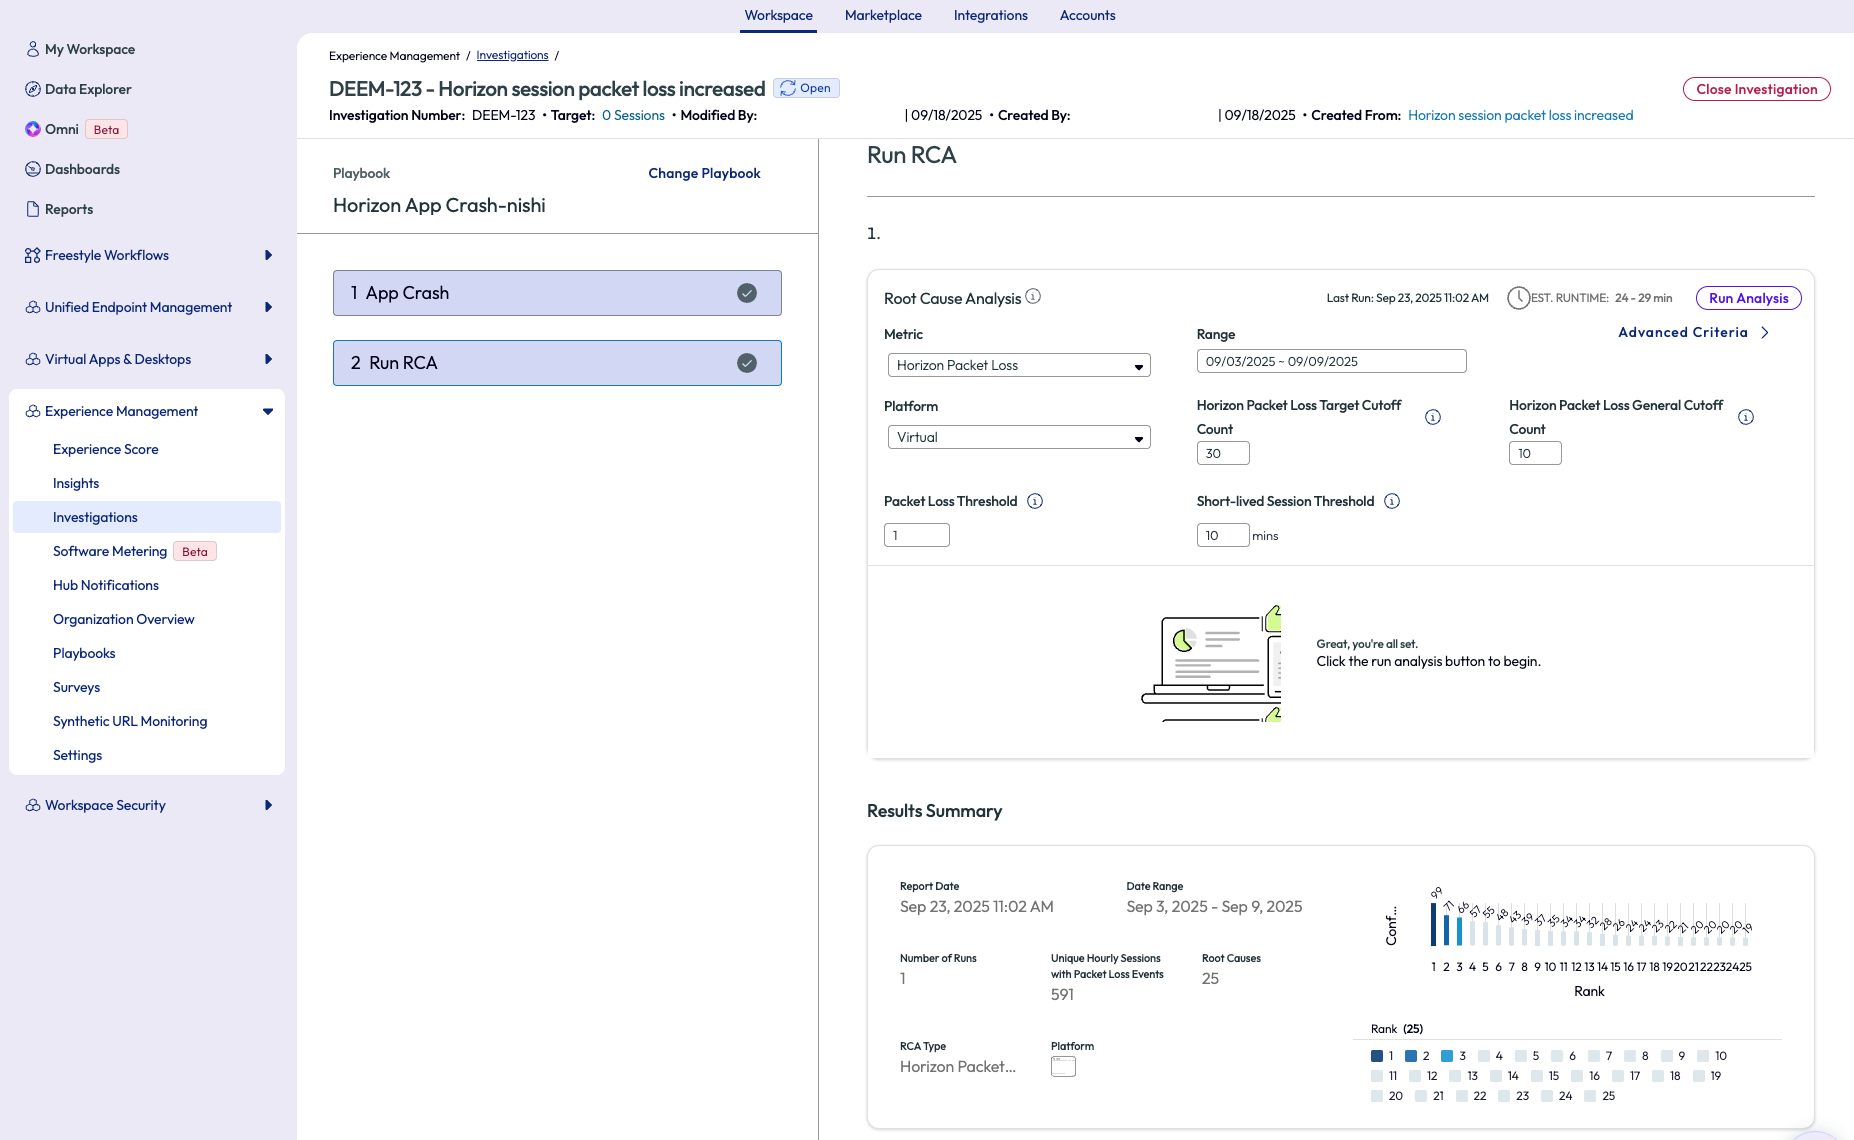
Figure 21: Example Investigation within Experience Management: view playbook to resolve issue, create custom dashboards, collaborate with colleagues, and perform RCA
Software Metering
The bigger the company the more software applications used across different teams. Especially with enterprise level companies, it can become a cost waste to automatically assign all applications to all employees. Using the Software Metering dashboards, admins can monitor software usage to unveil which licensed applications are truly used, versus assigned licenses with no usage. This information saves money for companies by using this insight to disable or repurpose application licenses where needed. Omnissa calls this feature Software Metering and it’s one of the fastest ways to see true ROI.
The Software Metering landing page displays an overview of the different managed and unmanaged apps in the environment. Click through the tabs to discover new apps, to see most used and installed apps, and to compare up to three applications at a time for a closer look.
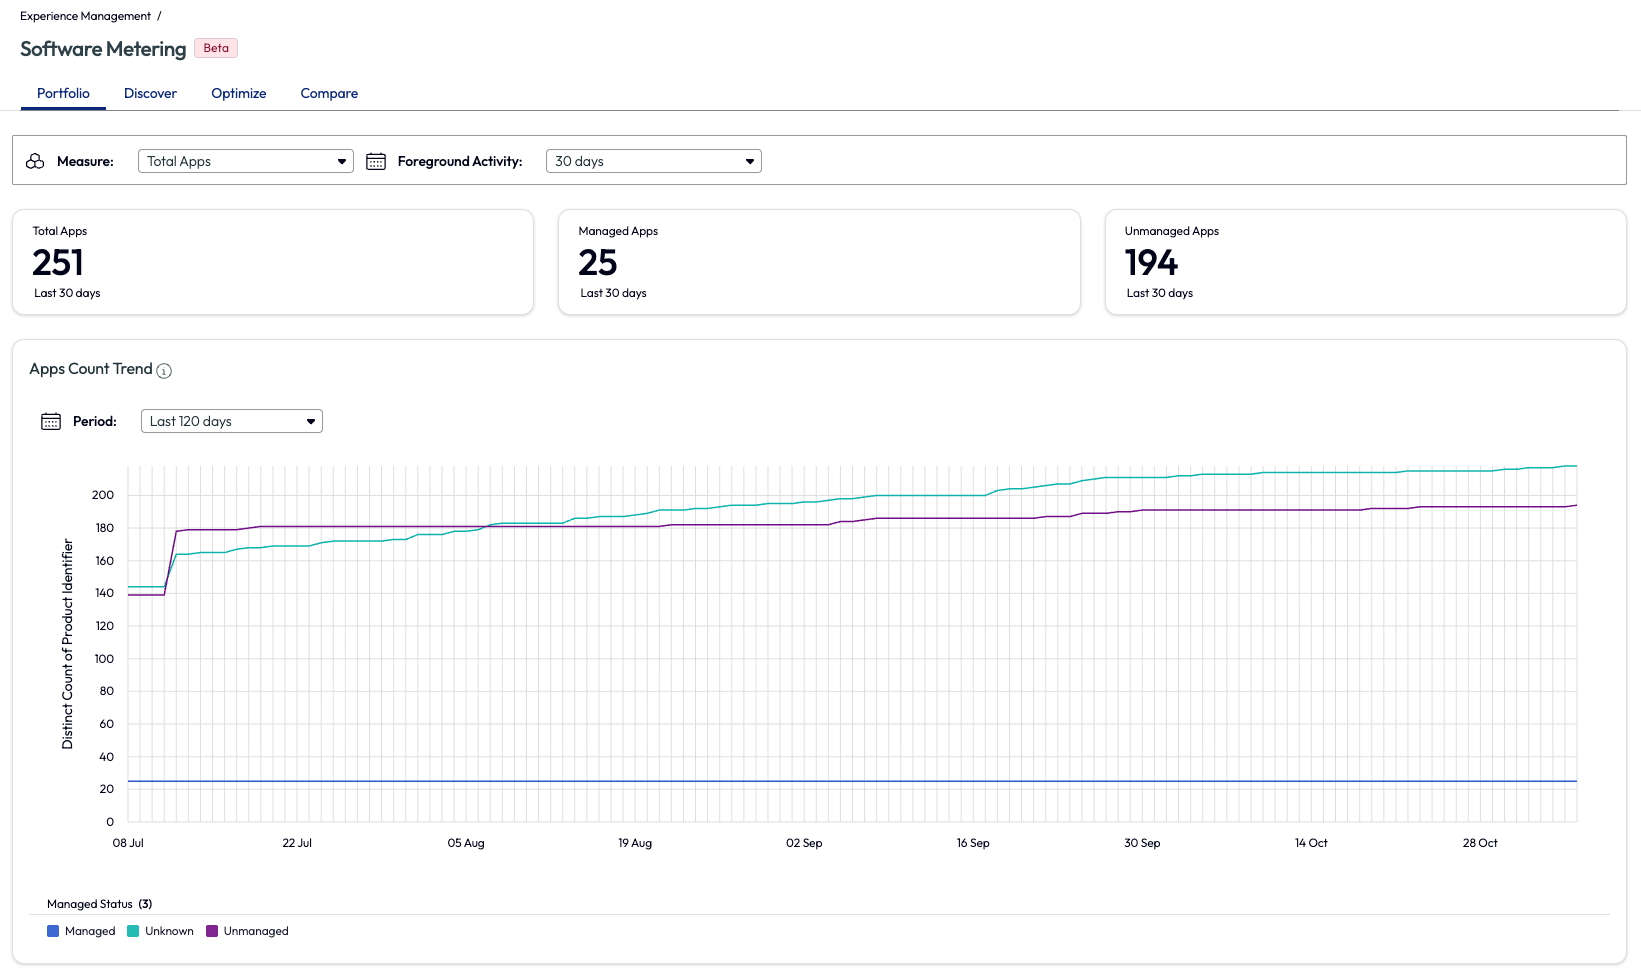
Figure 22: Software Metering overview and the count of managed, unknown, and unmanaged applications
If you scroll down on the page on the Portfolio, Discover or Optimize tabs, you will see a list of all applications with additional details. Selecting an app from the list will dive deeper into a specific application’s metrics and usage. This is where the tool proves it’s ROI and conclusions can be drawn for how and when to revoke, reuse, or repurpose licenses and save money.
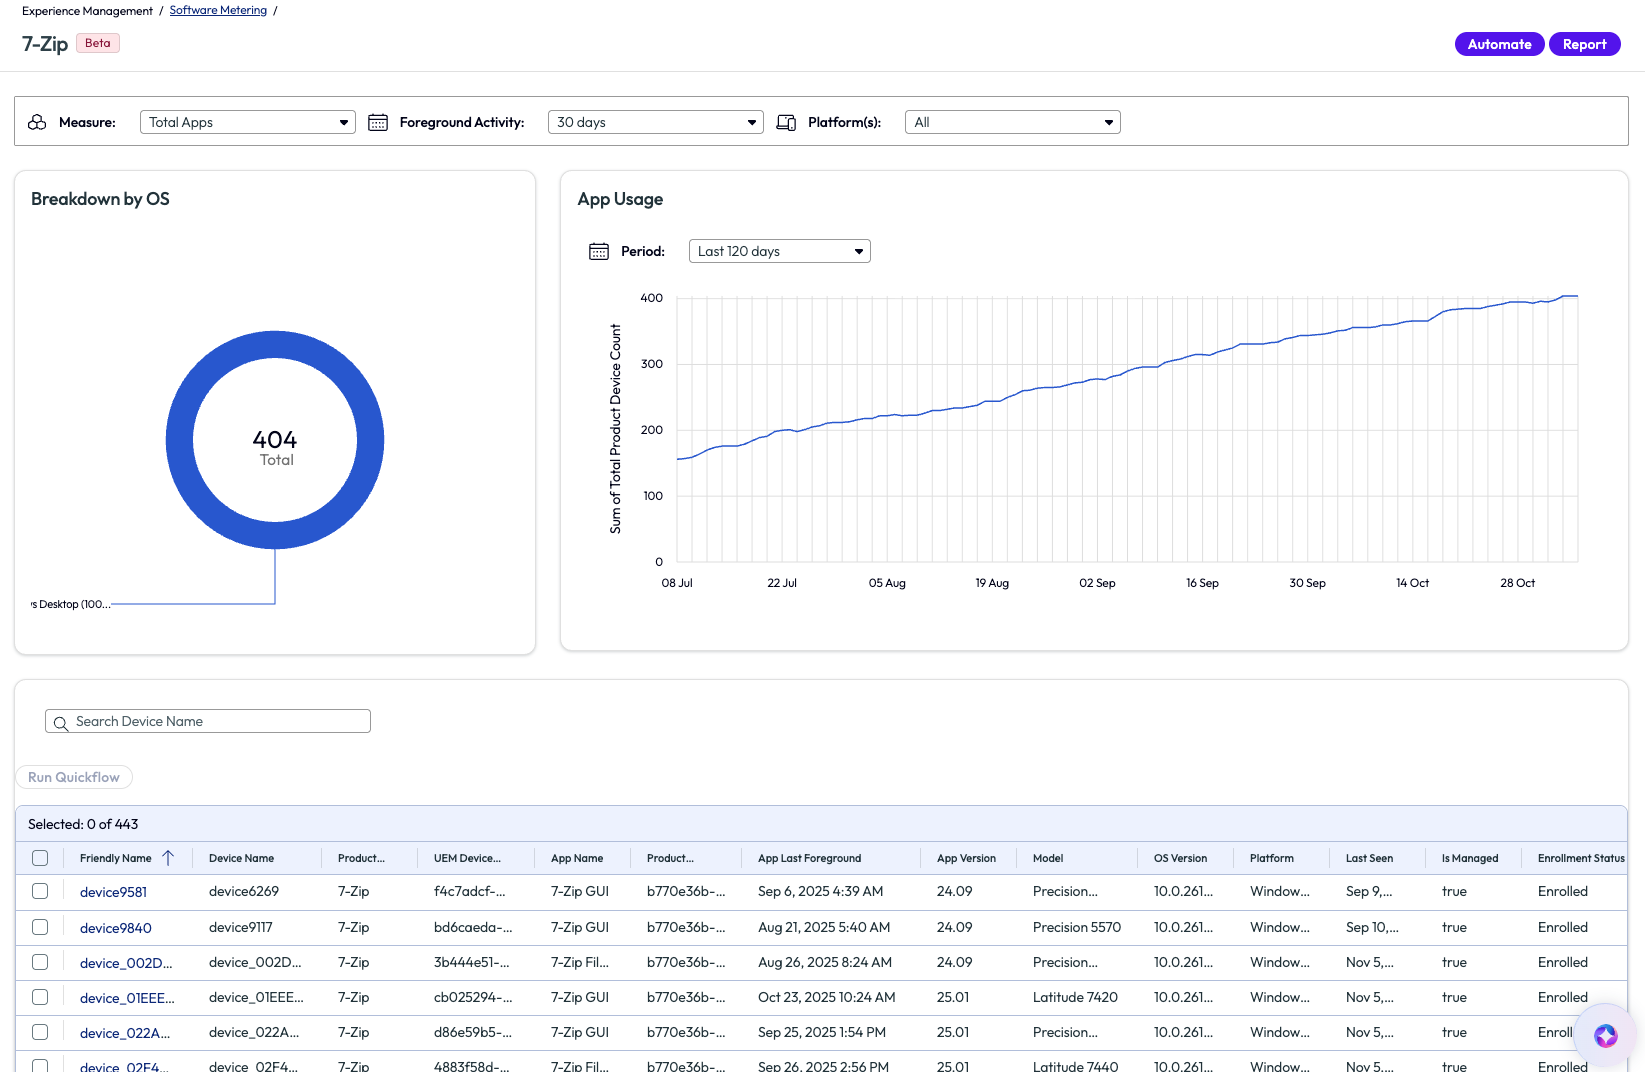
Figure 23: 7-zip total installs and app usage detail, list of devices with app details per device
Playbooks
Some devices issues that arise frequently can be resolved using the Omnissa Intelligence feature called Playbooks. This feature is designed to help support teams troubleshoot quicker without the need for individual training on common issues. This is accomplished by using the out-of-the-box Playbooks or creating custom Playbooks that walk support team members through troubleshooting step by step. Seen below in Figure 24 is an example Playbook built for Windows OS crashes, or blue screen of death (BSOD). In this particular out-of-the-box Playbook, a user is led through troubleshooting the error on a device by listing the most common causes for this failure. If the given step does not resolve the issue, then the user moves to the next step in the troubleshooting process. As the user progresses through the steps, they are shown more complex possible causes of BSOD and more options on how to resolve the OS crash.
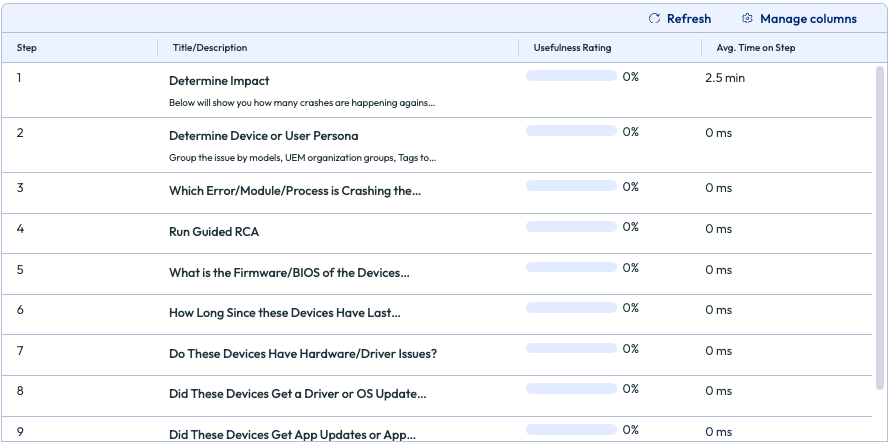
Figure 24: Windows BSOD Playbook with step-by-step troubleshooting guide
This feature also includes a feedback loop to track if the Playbook is effective. There is a rating system and an open feedback text box to allow for comments on the Playbook. Admins can see which Playbooks are used the most and how effective they are to the support team members.
Guided RCA
Within an Investigation, there is a tool that is designed to assist with debugging widespread application crashes and hangs, OS crashes, slow boot events, and Horizon logon duration and latency; this tool is called Guided RCA. Machine learning is leveraged to analyze data around the time of an incident to identify potential root causes without the admin performing lengthy manual root cause analysis (RCA).
Choose the metric to analyze and the date range around when the incident occurred (up to 7 days) then click the Run Analysis button. Data analysis can take several minutes to process. Note that the selected date range must include at least 100 app crashes, OS crashes, or slow boot events for the tool to provide results.
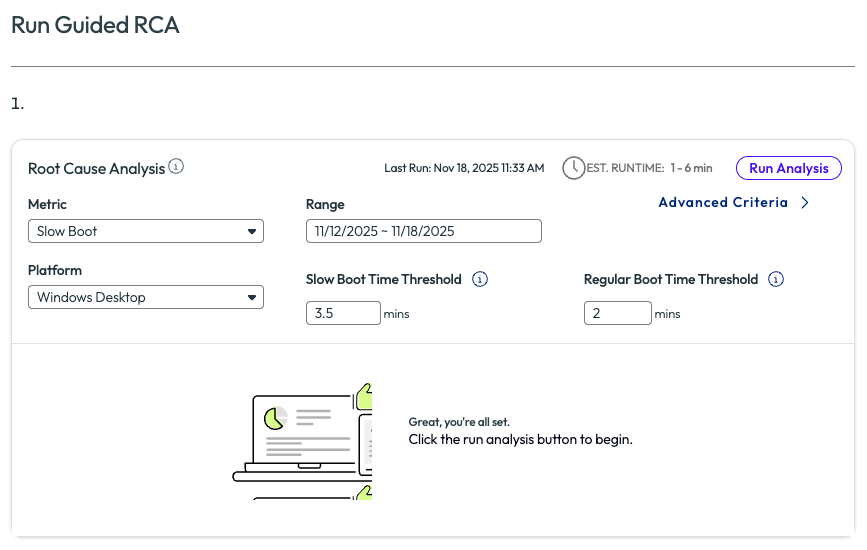
Figure 25: The Guided RCA tool within an Investigation before running analysis
Once the tool has completed analysis, the results are found below on the same page by scrolling down.
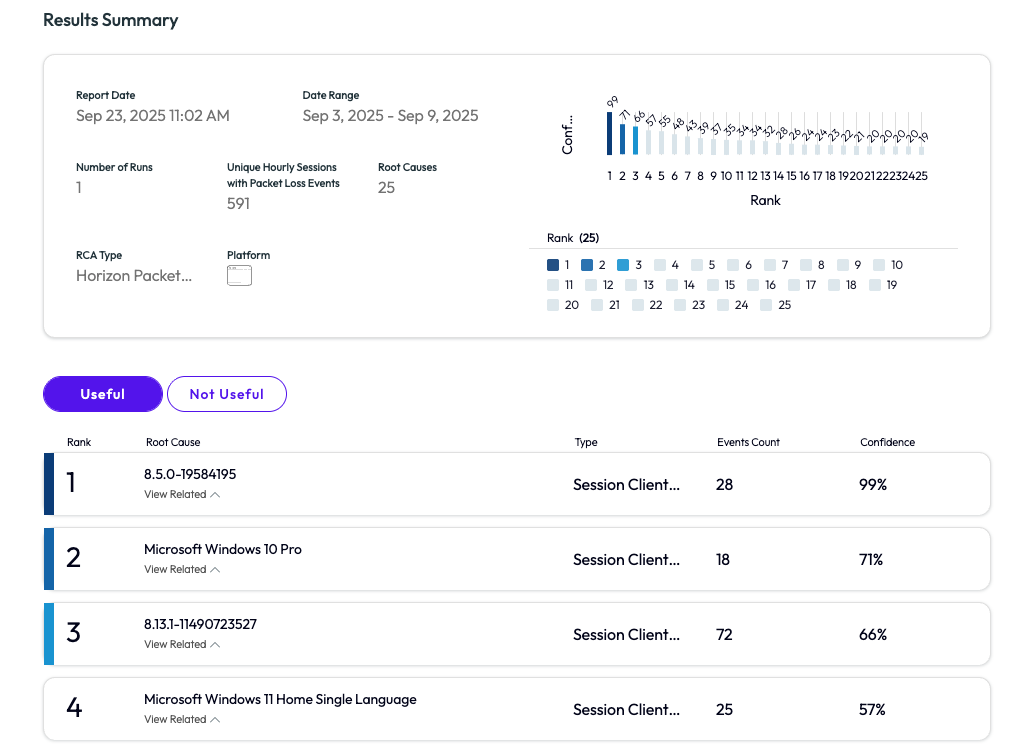
Figure 26: Results from the Guided RCA tool
Within the Guided RCA results, expand any result to view devices that experienced the event.
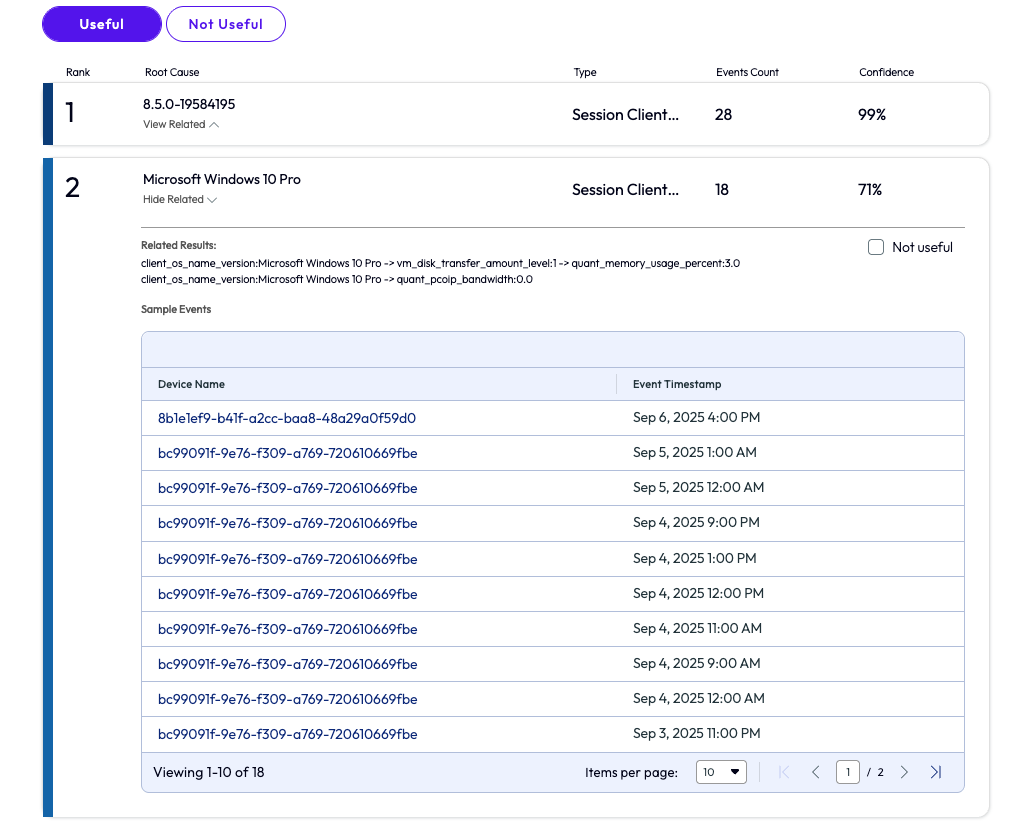
Figure 27: Expand an RCA result to view a list of sample events that were used to analyze the root cause of an issue
From here, you can click on the device name to view the device details screen, with detailed event timeline, to further investigate suspected causes of the issue. Remember: this feature is designed to help find widespread issues. If an issue is occurring on less than 100 devices, then no data will be retrieved.
To learn more about the Guided RCA tool within Experience Management, review the product documentation.
Hub Notification analytics
Workspace ONE Intelligent Hub is an application that delivers a consumer-simple, enterprise-secure digital workspace to employees, on any device in any location. One of the key capabilities of the Intelligent Hub app is a notification framework used to deliver customized corporate communications and surveys. Experience Management within Omnissa Intelligence includes a dashboard to track Hub Notification analytics.
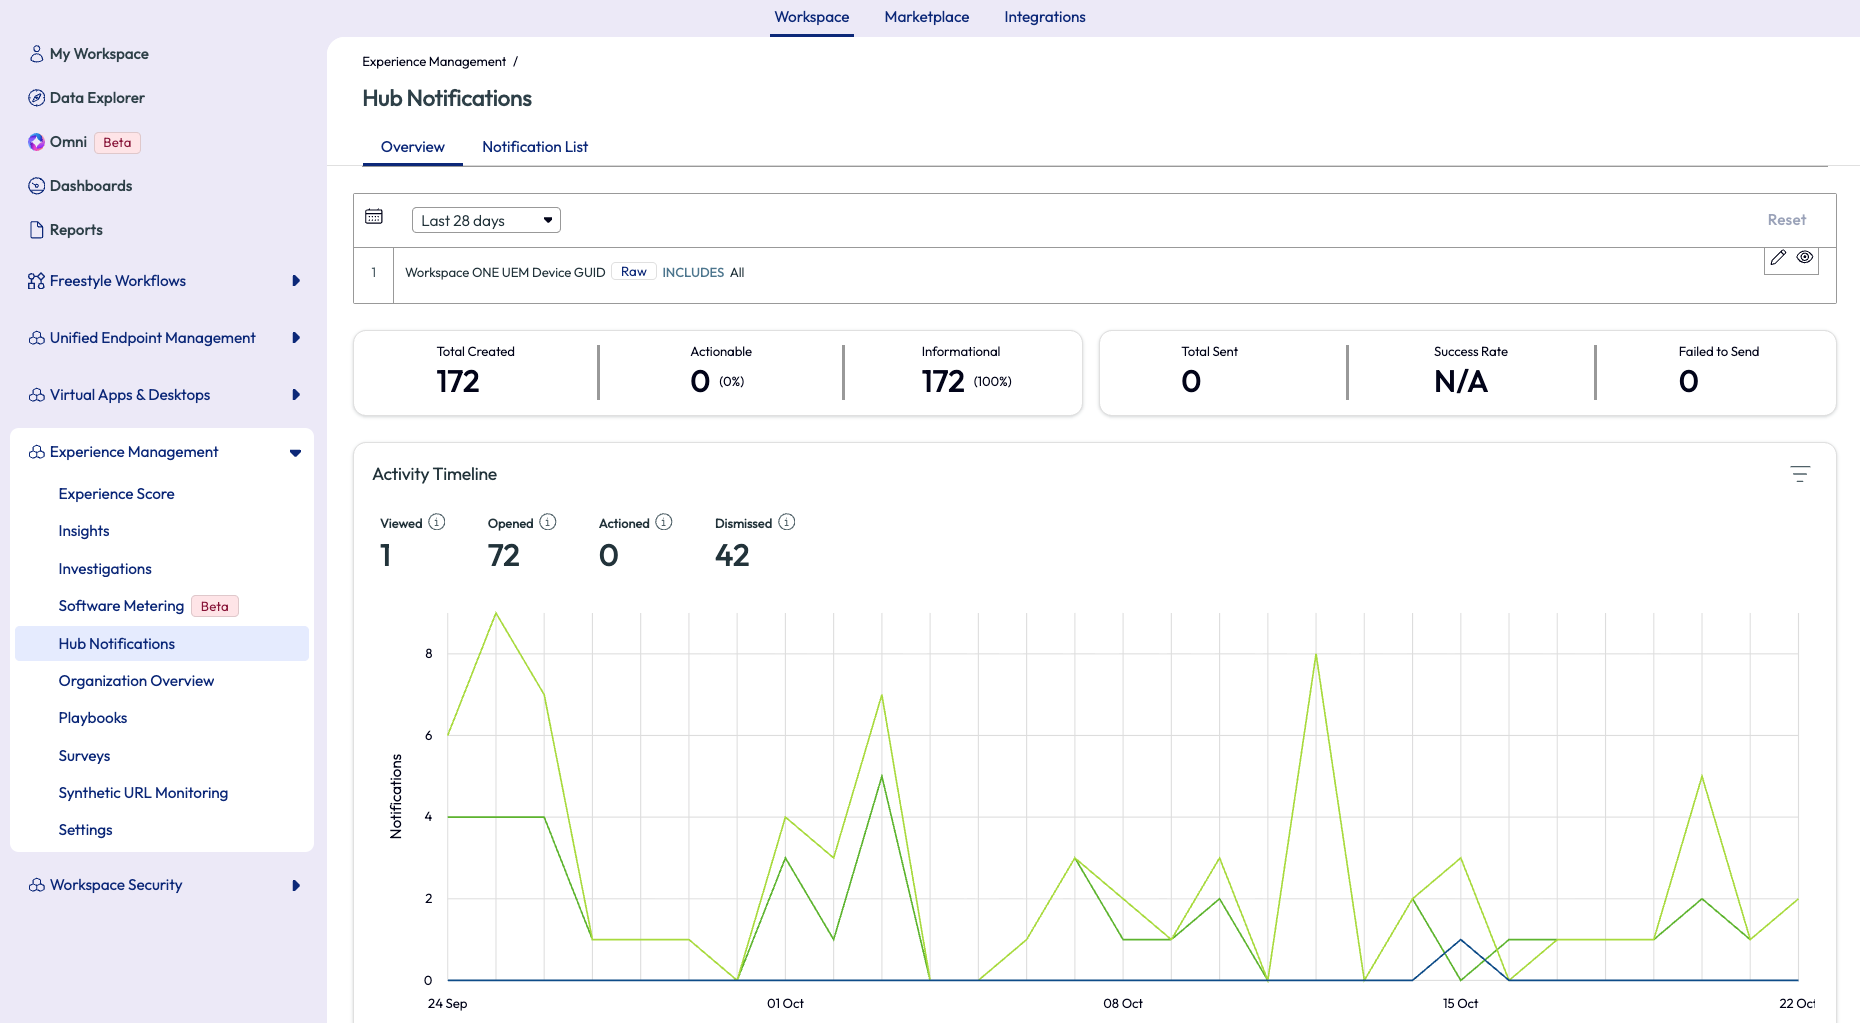
Figure 28: Hub Notification analytics within Experience Management
Check out these resources to learn more about Workspace ONE Intelligent Hub and the Notification Service:
Surveys
When measuring DEX, or the Digital Employee Experience of users, a key input is employee sentiment, which is typically measured using surveys. For example, surveys can be used to gather feedback on a new device type, new web or mobile application, or after an operating system upgrade or security patch. Employee sentiment can then be combined with metrics from devices and apps to create an overall picture of an organization’s DEX health. When setting up a survey, there are a few pre-built questions that can be utilized, or admins can choose to create a customer question survey.
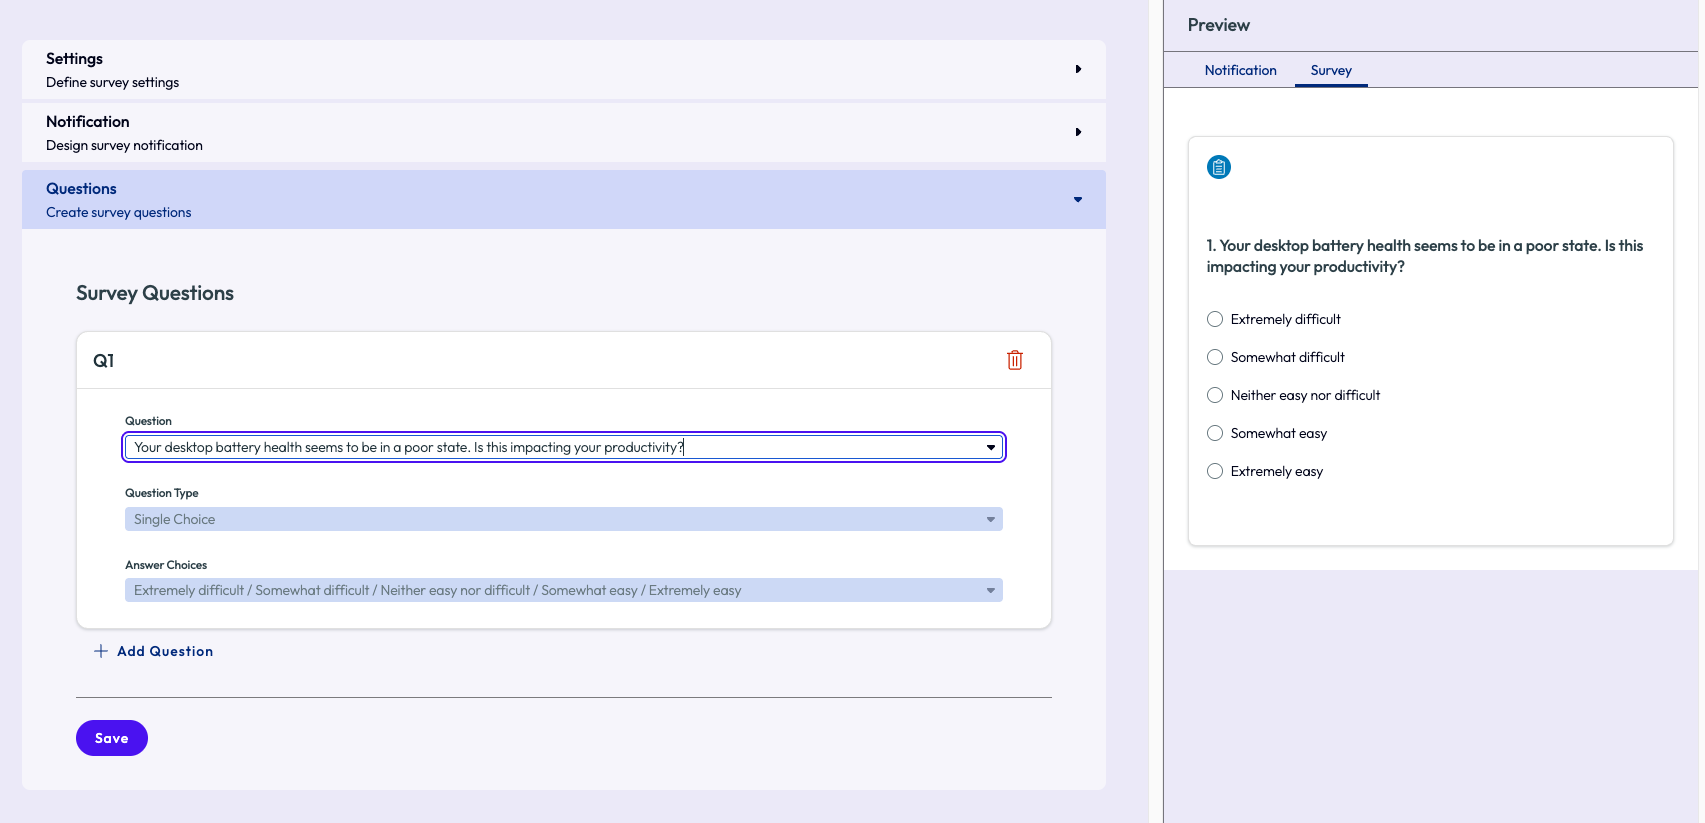
Figure 29: Creation of a new survey
Experience Management includes the ability to create custom surveys and deliver them to employees via the Workspace ONE Intelligent Hub app on desktop and mobile devices or through a web browser. Then survey responses and analytics can be viewed within Experience Management. In addition, automated workflows can be built based on survey responses, such as automatically creating a helpdesk ticket if an employee reports device issues via a survey. Or on the other hand, automatically send a survey to an employee that experiences an app or OS crash to see if they need help. These workflows are critical for proactively supporting end users.
Review the survey product documentation to learn more.
Workflows
Freestyle Orchestrator is the low-code/no-code, drag-and-drop workflow platform built within Omnissa Intelligence. Telemetry collected from devices and apps and employee survey responses can be used to trigger automated workflows and even integrate with third-party business applications, such as IT Service Management (ITSM) or procurement systems. See the Freestyle Orchestrator product documentation to learn more.
Create a new workflow to automate IT processes and issue resolutions in your environment. From the Freestyle Workflows feature select Add Workflow to begin building.
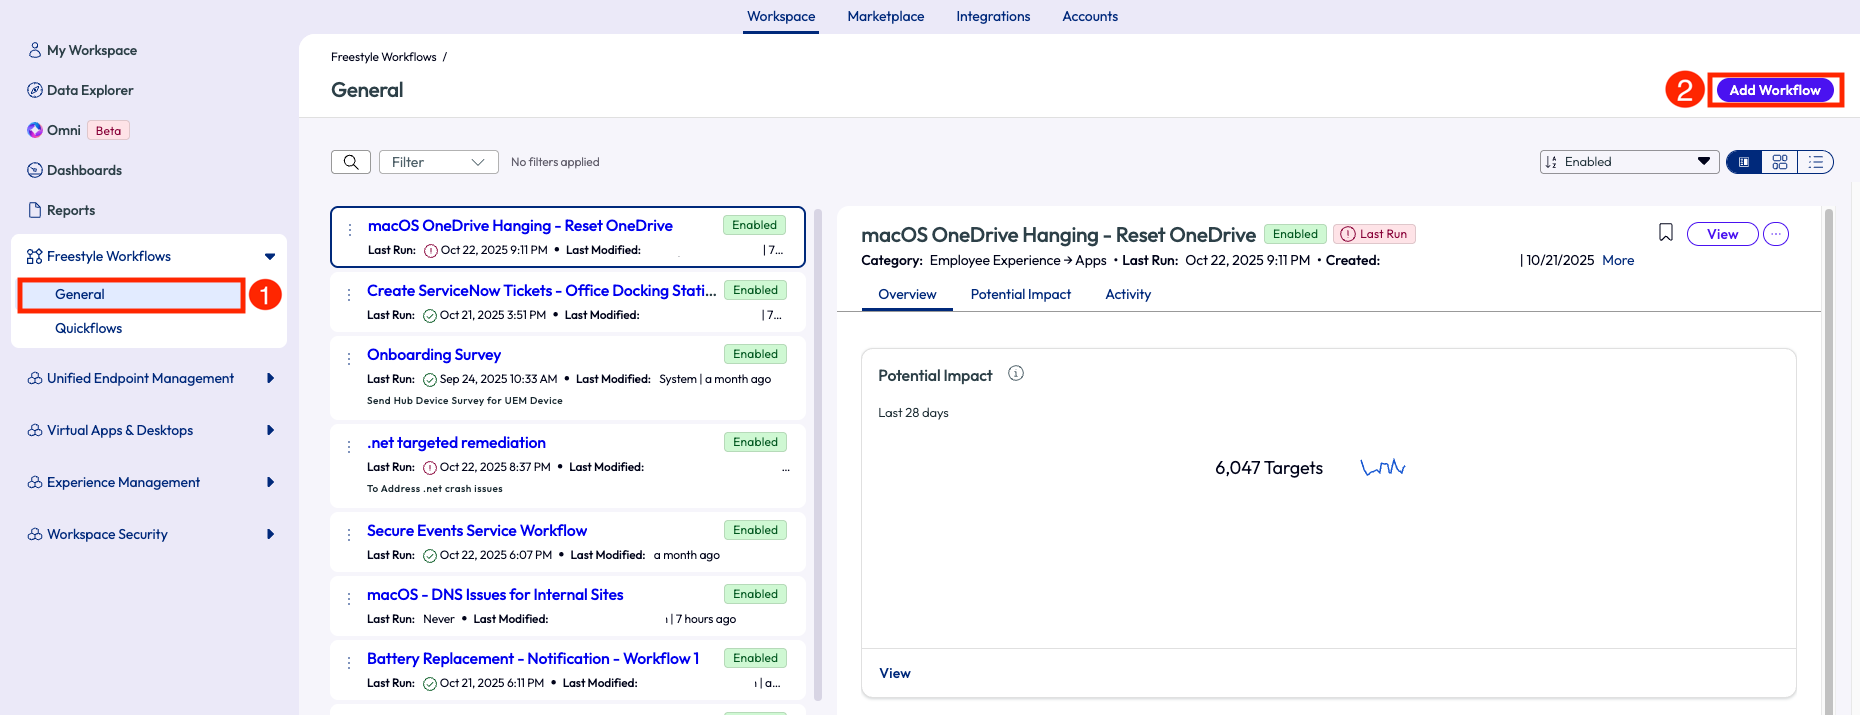
Figure 30: Creating a new workflow in Freestyle Workflows
Workflows can also be built to send automated alerts when metrics reach a certain threshold, such as app crashes or high memory utilization on devices. This is another strategy for providing proactive support to employees.
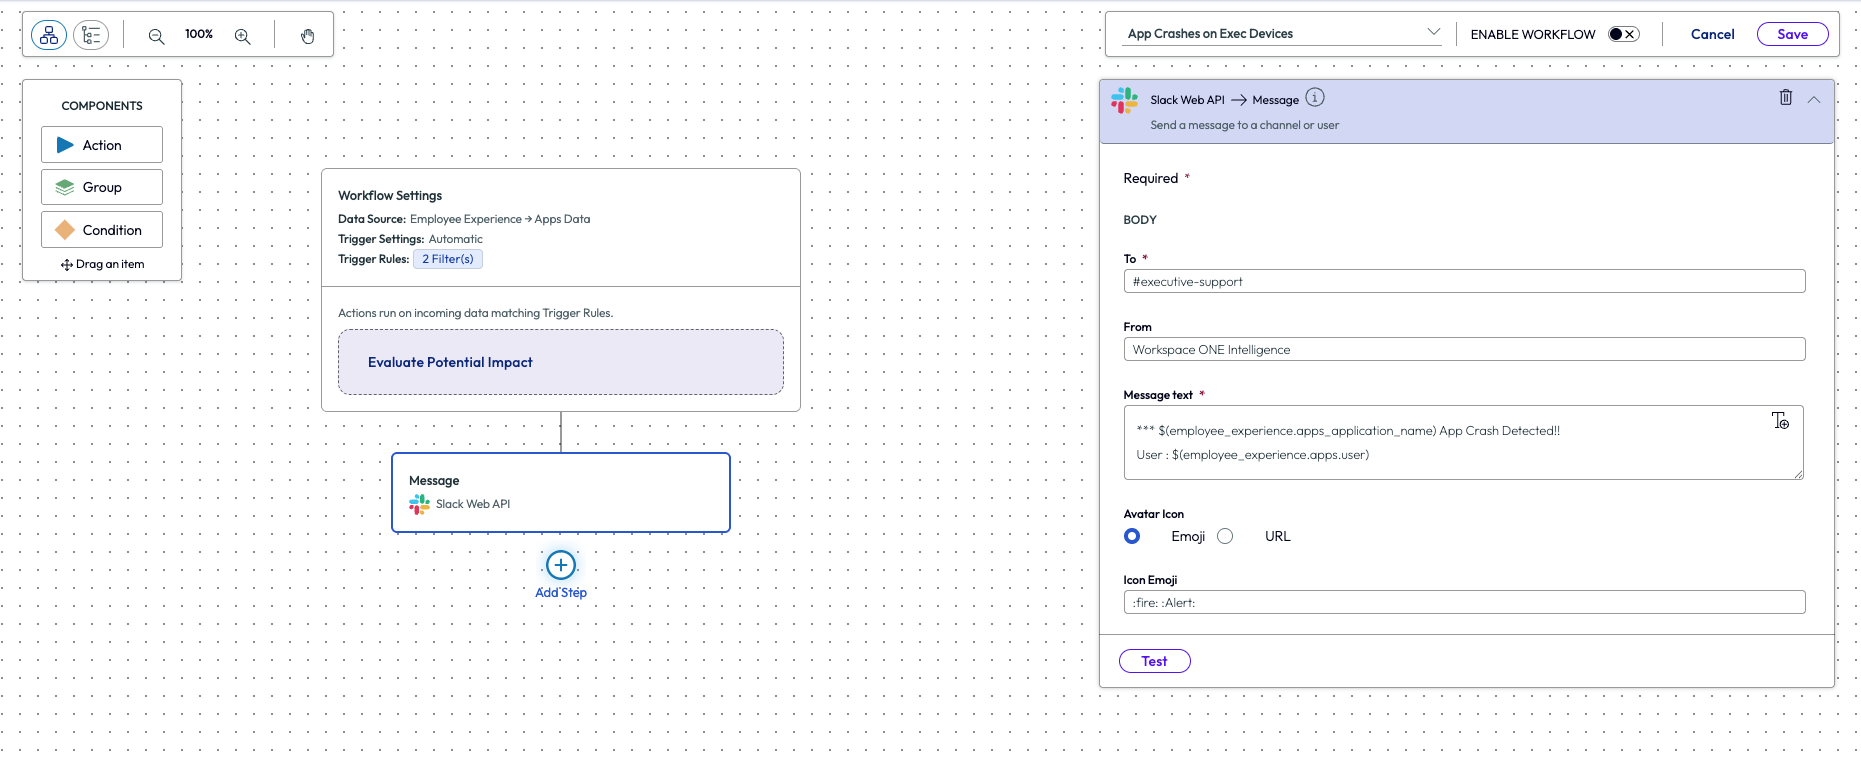
Figure 31: Intelligence workflow example: building an automated service desk alert for an app crash on executive devices
More complex automations can be built as well, such as license optimization of an app. Conditional clauses can also be incorporated into the workflow, such as IF/THEN statements.
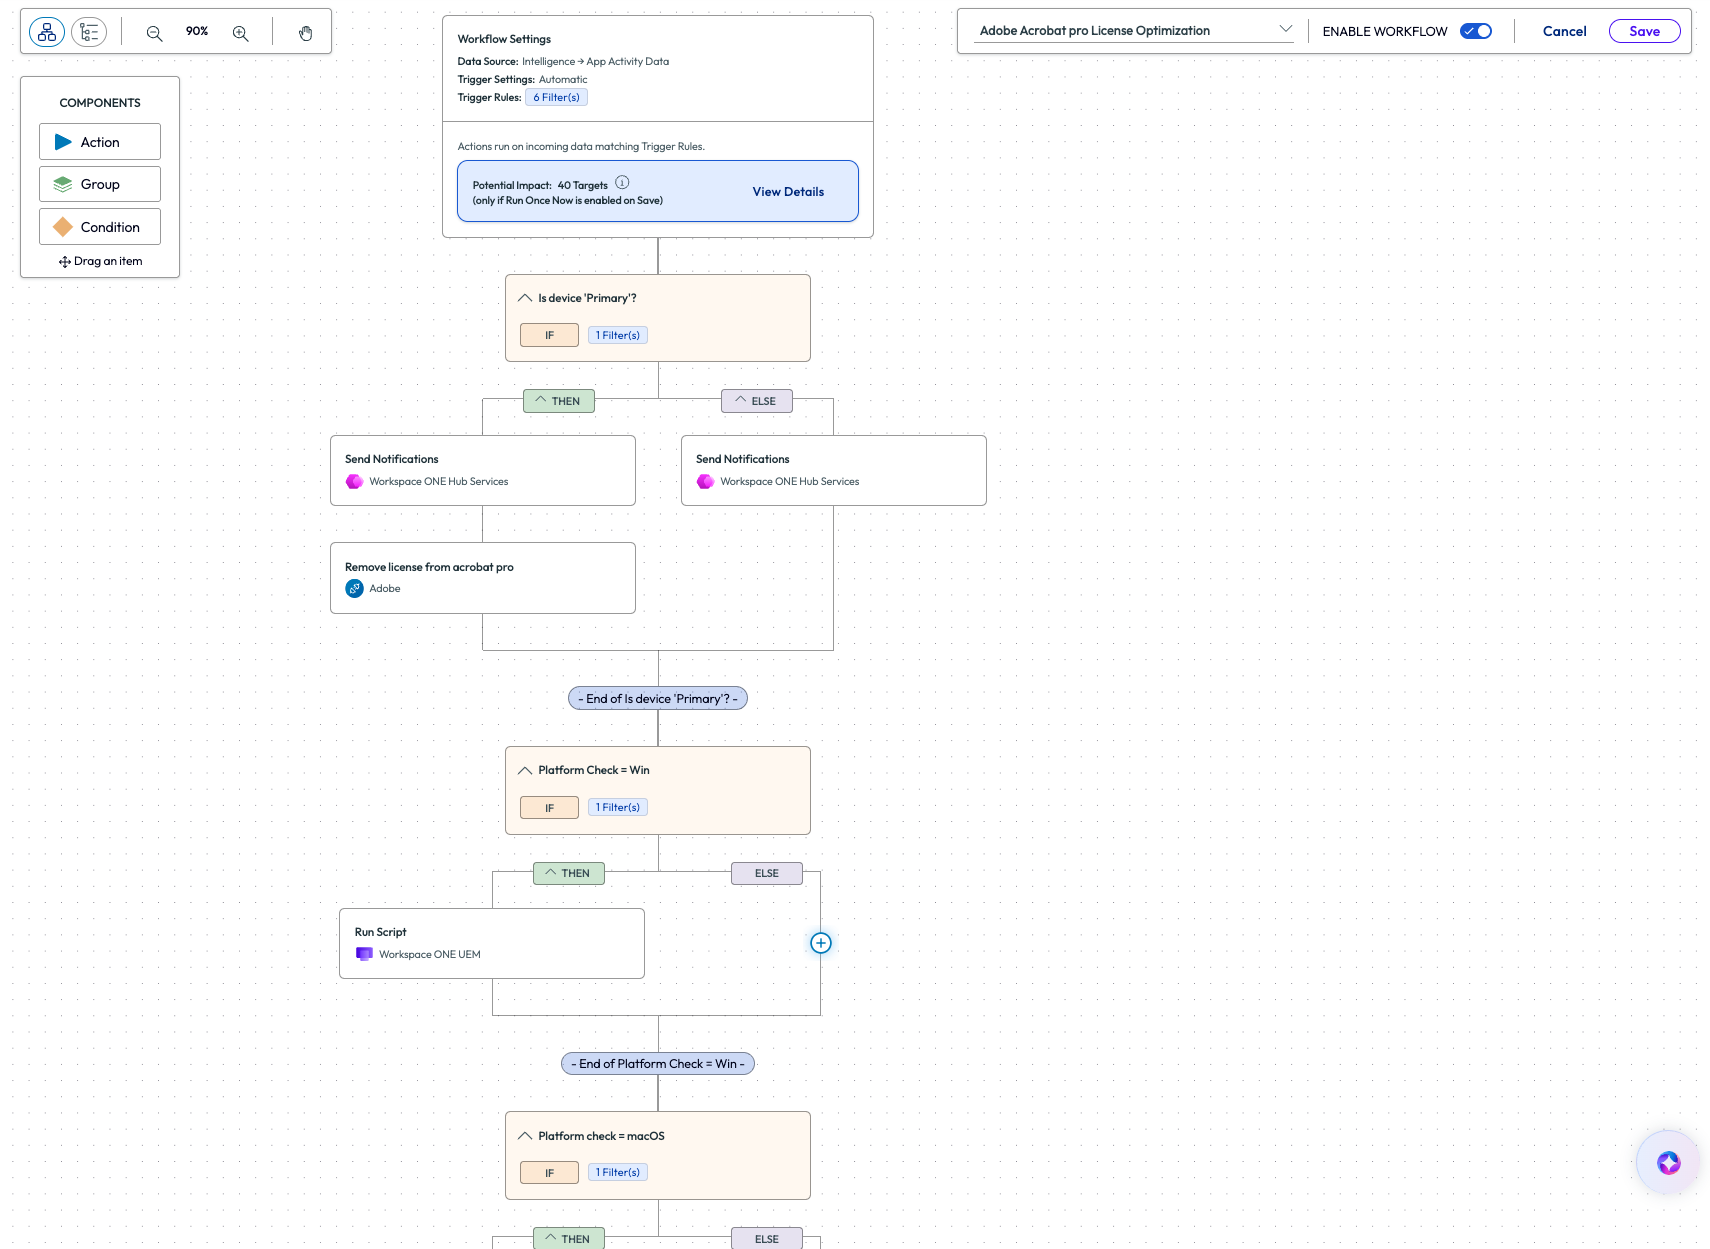
Figure 32: Intelligence workflow example: building automated license reclamation with multiple conditions
Or combine Experience Management surveys with workflows to automatically run a disk cleanup based on the results of a survey.
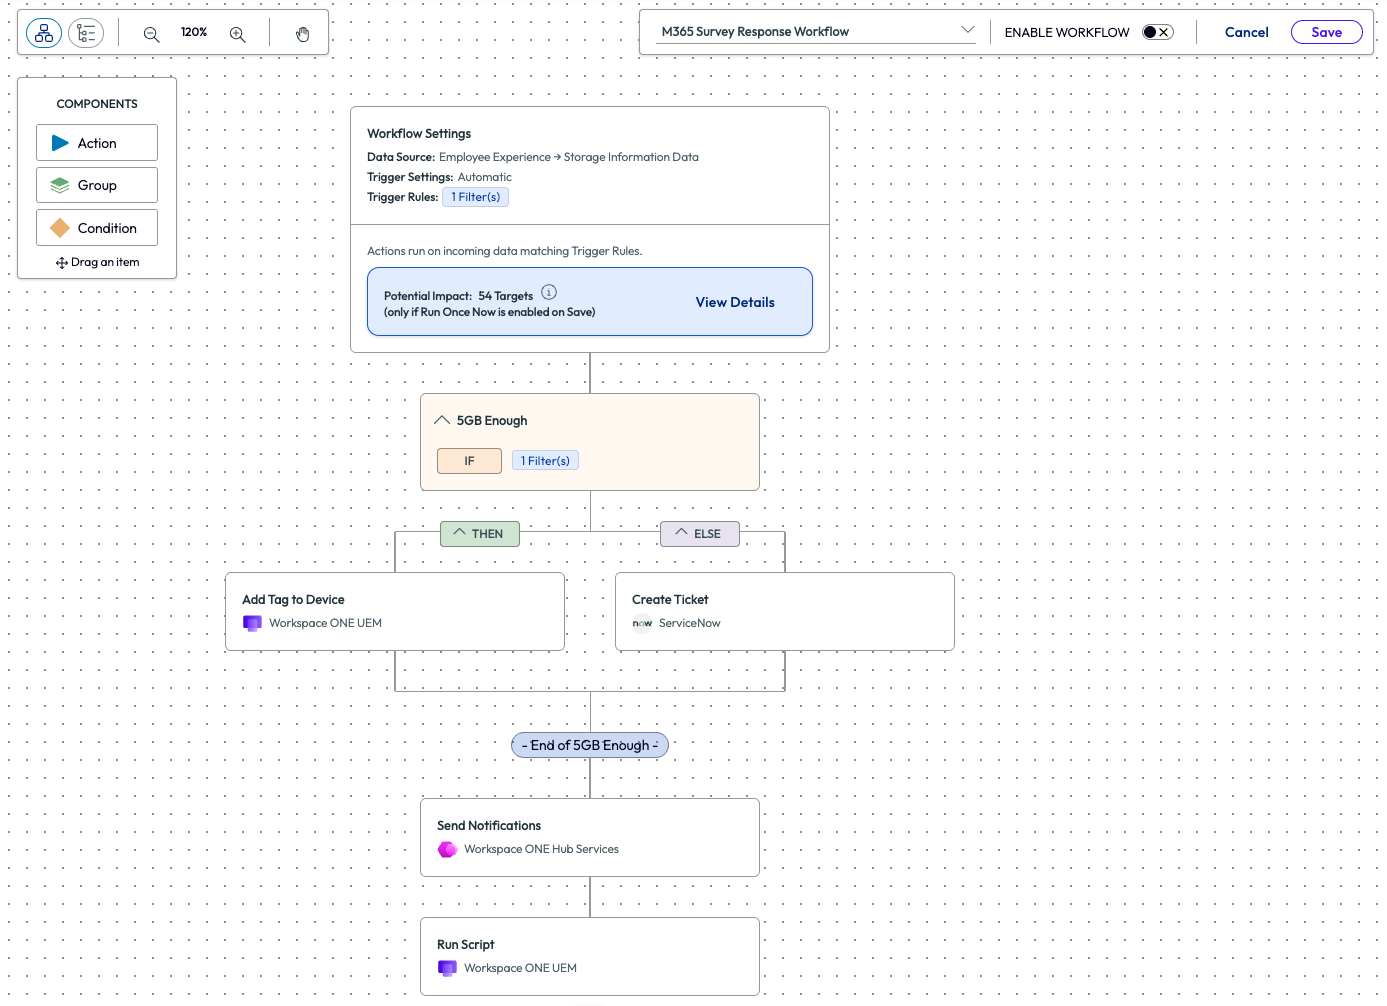
Figure 33: Intelligence workflow example: automatically run disk cleanup based on the results of a survey, including nested if-then statements
Synthetic URL Monitoring
Another critical method to provide proactive support for employees is knowing if a service is unavailable before service desk tickets are created, and even notifying teams proactively to reduce inbound tickets. Experience Management includes a tool to proactively monitor URLs or web applications (hosted internally or externally) in order to identify network performance and availability. But instead of a server monitoring a URL, the Synthetic URL Monitoring tool provides data from the perspective of a device connecting to a URL. In other words, Omnissa Intelligence is collecting application uptime data from end-user devices. Then automated workflows can be created to notify groups of users or automatically create service desk tickets based on the test results.
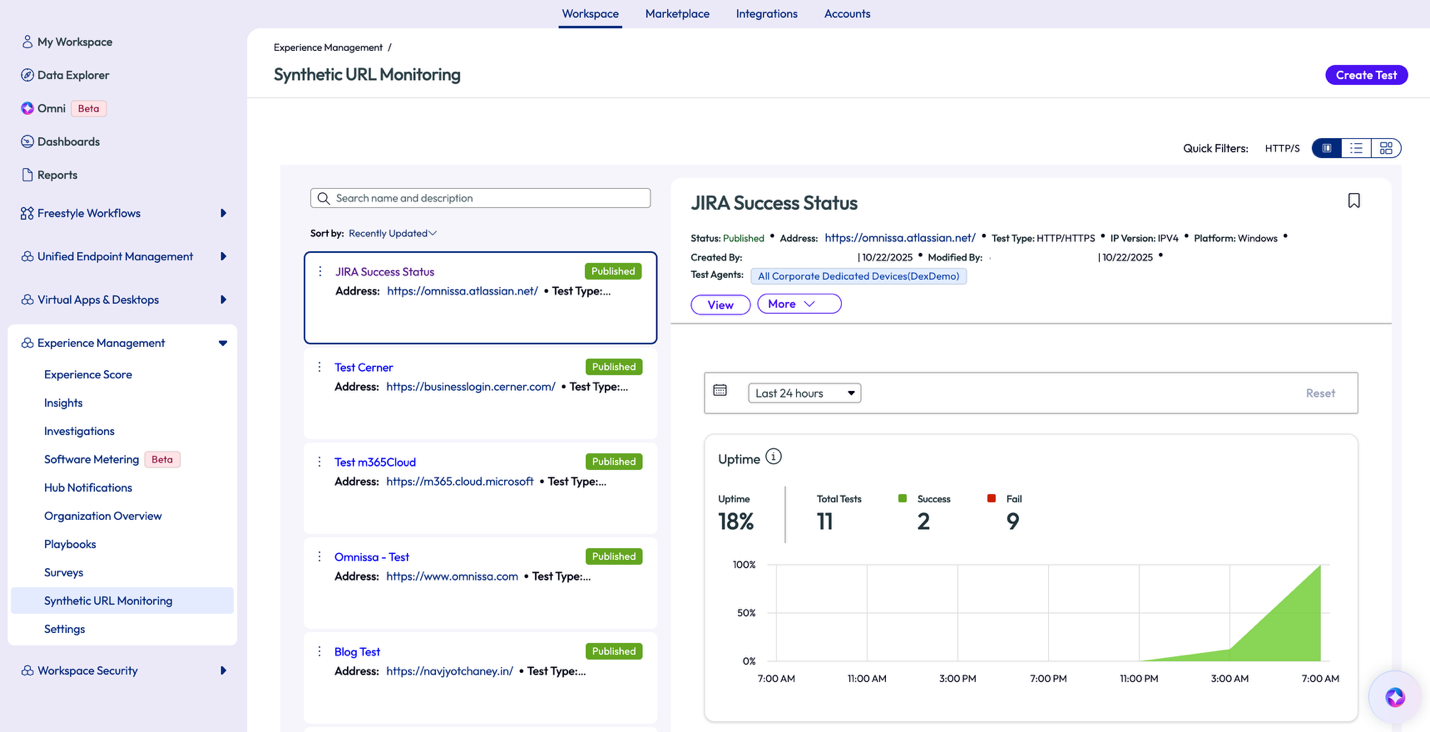
Figure 34: Synthetic URL Monitoring test results
Review the product documentation to learn more about Synthetic URL Monitoring within Experience Management.
Web App Monitoring
While Synthetic URL Monitoring proactively checks for common network connectivity issues from the perspective of a device, Web App Monitoring takes a different viewpoint, one from a user’s point of view. This feature monitors metrics such as page load speeds, network connectivity, app errors, browser errors, DNS resolution time and more. This perspective gives a real-world idea of how a user would view load times, interaction failures, and responsiveness of specific web apps.
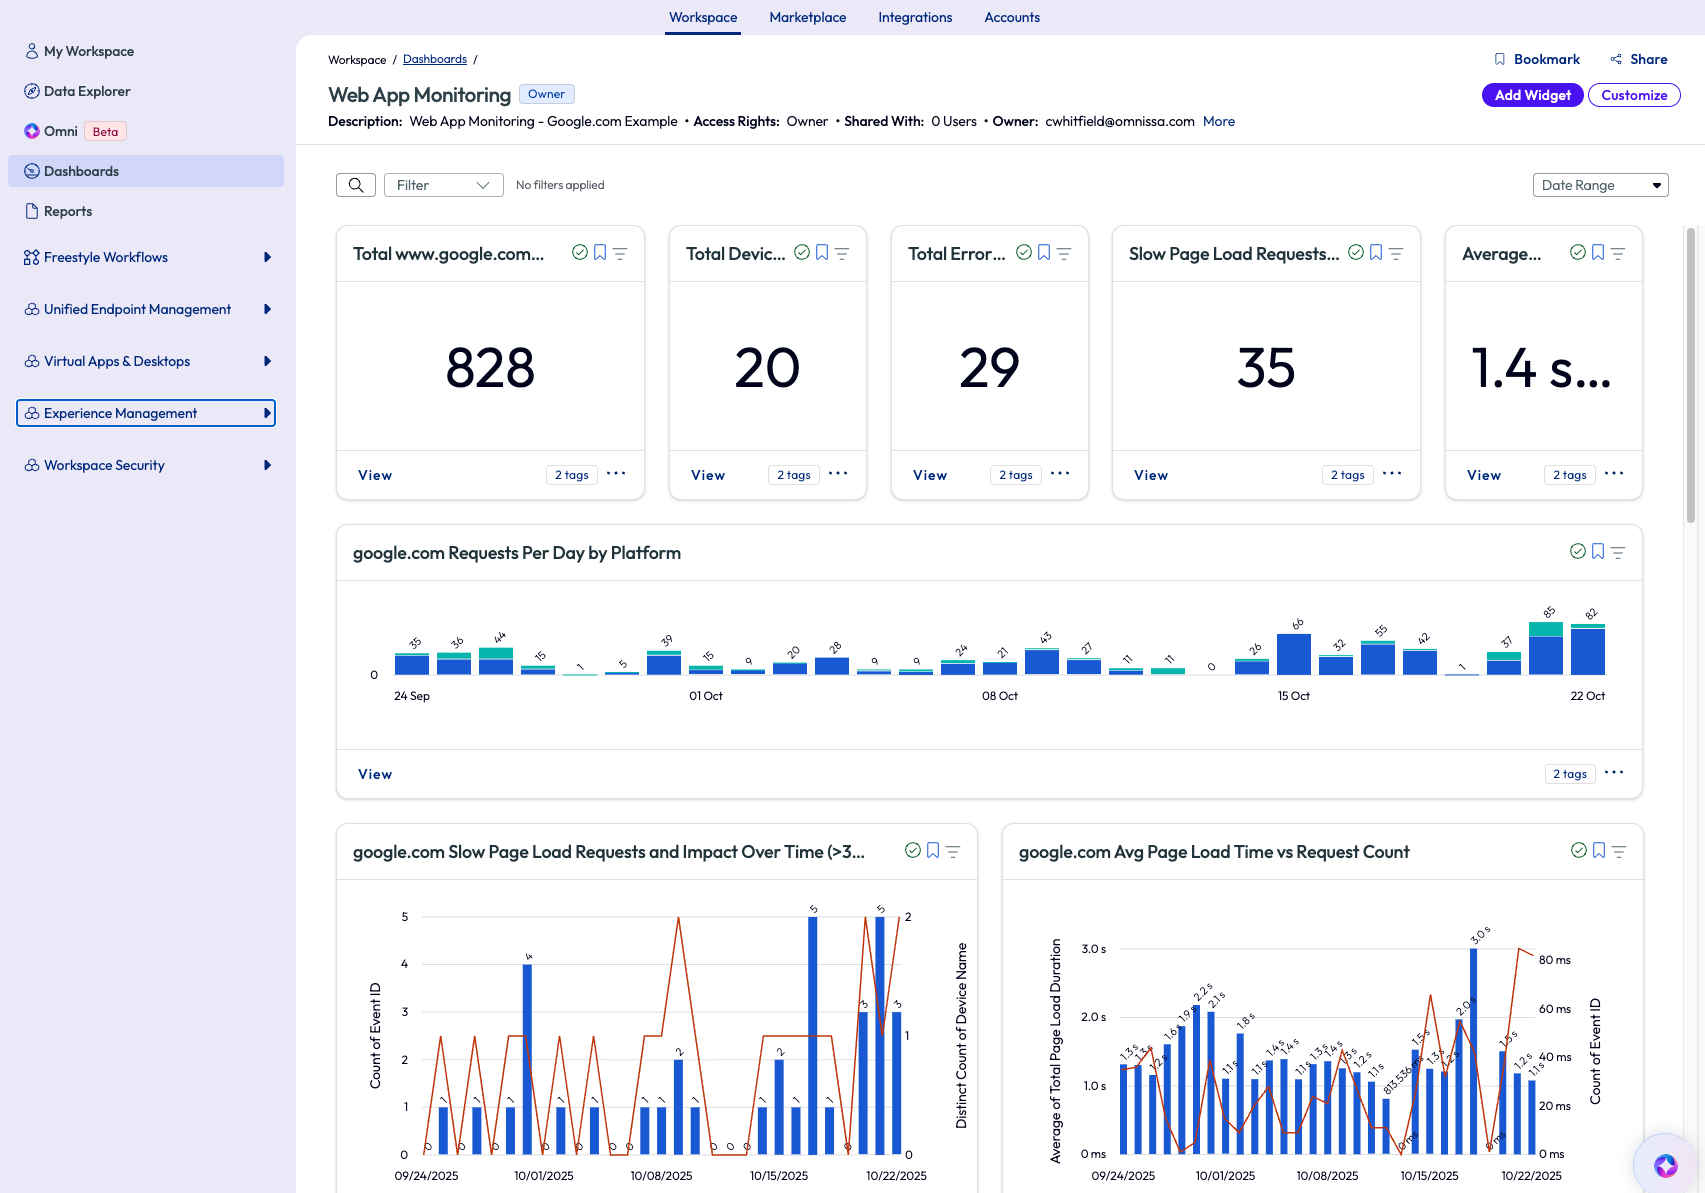
Figure 35: Web App Monitoring dashboard for Google.com
Example use cases
Overview
Many business and IT challenges drive an organization to implement DEX tools. Typically, these solutions impact the following three personas:
Service Desk and Support Teams
- Real-time remote assistance tools
- Surface device/app data and scripts to L1/L2 service desk via ITSM integration
- Measure employee experience on devices across any platform
- Employee sentiment feedback tools
- Track service availability and performance
- Track impact of OS and app updates
- Automated remediation via workflows and scripts
IT Planning Teams
- Prevent loss of frontline devices
- App license optimization
- Device lifecycle management
- Physical and virtual device right-sizing
- Hardware and app adoption, performance and usage trends
Employees
- Seamless experience via unified app catalog and single-sign-on
- Proactive employee communication
- Self-service references, tools, and scripts to resolve device issues
- Employee directory search
- Employee onboarding resources
The Workspace ONE platform covers the use cases in the personas above and more. However, Experience Management, a significant component of the overall Omnissa DEX solution, is focused on how to gain insight and value from telemetry collected from devices, whether root cause analysis, IT planning, or using collected data to drive automated workflows.
Table 2: Example Experience Management use cases
| Category | Impact on User Experience |
| Change management | Track impact of new OS versions OS version adoption Best OS version experience Worst OS version experience BIOS version update Pending OS updates Reboot > 30 days Trending connected hardware |
| App lifecycle management & license optimization | New app version adoption Trending apps App install failures Best app experience Worst app experience Most used apps Least used apps App user sentiment |
| Lost Frontline devices | Inactive devices Checked-in devices not charging or low battery Max charge capacity Power plans |
| Device refresh | New active device models Top active device models Best model experience (CPU/memory) Worst model experience (CPU/memory) Device user sentiment |
| Self-healing digital workspace | Failed automations Top automations |
| Network planning | Poor performing Wi-Fi networks/SSIDs Most popular SSID |
After Experience Management has been enabled within Omnissa Intelligence, how can we extract value from this technology and truly impact the business and IT operations? The following are a few real-life customer examples.
Achieving value in 1 week
We can see how simple it is to derive value from Experience Management in as little as one week:
A bank set up a trial of Experience Management for 111 Windows devices that were just enrolled using Registered Mode within UEM, versus full management. Within an hour, the IT team was able to quickly see that about 65% of devices had a poor Experience Score, and the main contributor to the poor score was memory health (utilizing 85% or more of memory capacity).
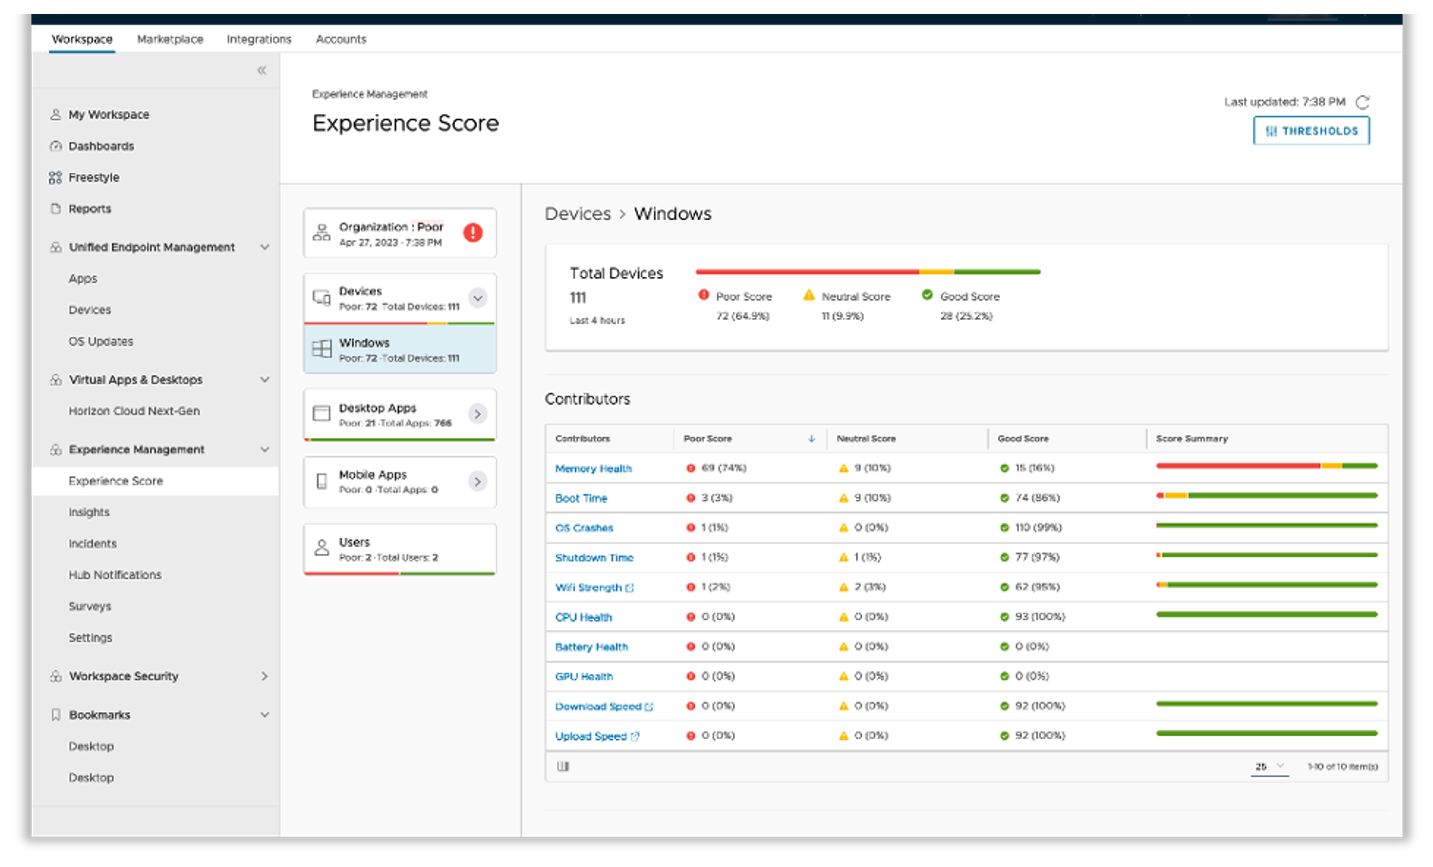
Figure 36: Customer’s Experience Score dashboards within Omnissa Intelligence after configuring Experience Management
This customer’s service desk team confirmed that most of the users had devices with 8GB memory and agreed the machine specifications clearly are not enough to run applications required for the business. However, the team now has data to back up this claim. In the next device refresh, they will invest in devices with 16GB memory.
The team also drilled down into devices that already had 16GB memory and was able to show that a device with 16GB memory only had 55% memory utilization at worst.
This is another proof point that if they invested in devices with increased memory, the experience issue related to poor memory health problem could be resolved.
This customer has now set up an alert when Omnissa Intelligence detects a device with high memory utilization. This will enable the service desk to become more proactive and provide assistance before the end user creates a helpdesk ticket, and also provide visibility into users that are silently suffering.
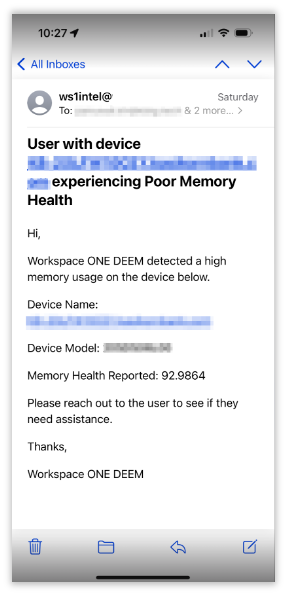
Figure 37: Automated alerts configured in Omnissa Intelligence notify the service desk when a device has high memory utilization, enabling proactive IT
Next, the team wanted to understand if a particular application is dominating most of the memory on employee devices. In order to look at the impact of the applications on memory utilization, the team created a dashboard to show average memory usage per app. Microsoft Teams was the application using the most memory, followed by Chrome and McAfee. They were all under 20MB each. This shows that there isn’t just one application to blame for the high memory utilization. The conclusion is that the memory issue is a system specification issue, rather than an application issue.

Figure 38: Omnissa Intelligence dashboard showing average memory usage per application on Windows devices
Then the customer viewed the desktop app Experience Score dashboard. The application with the poorest experience, based on app crash rate and with the greatest user impact was the Java Platform SE binary used by Java-based apps and websites. Drilling into the application the team saw there were multiple versions of this library deployed, and the issue was only seen with an old library version (6.0.260.3). The customer was surprised to see this library still deployed in their environment. The newer version of the library is not experiencing these application crashes. The customer will check with their apps team to confirm no business apps require this version of the library and upgrade impacted devices.
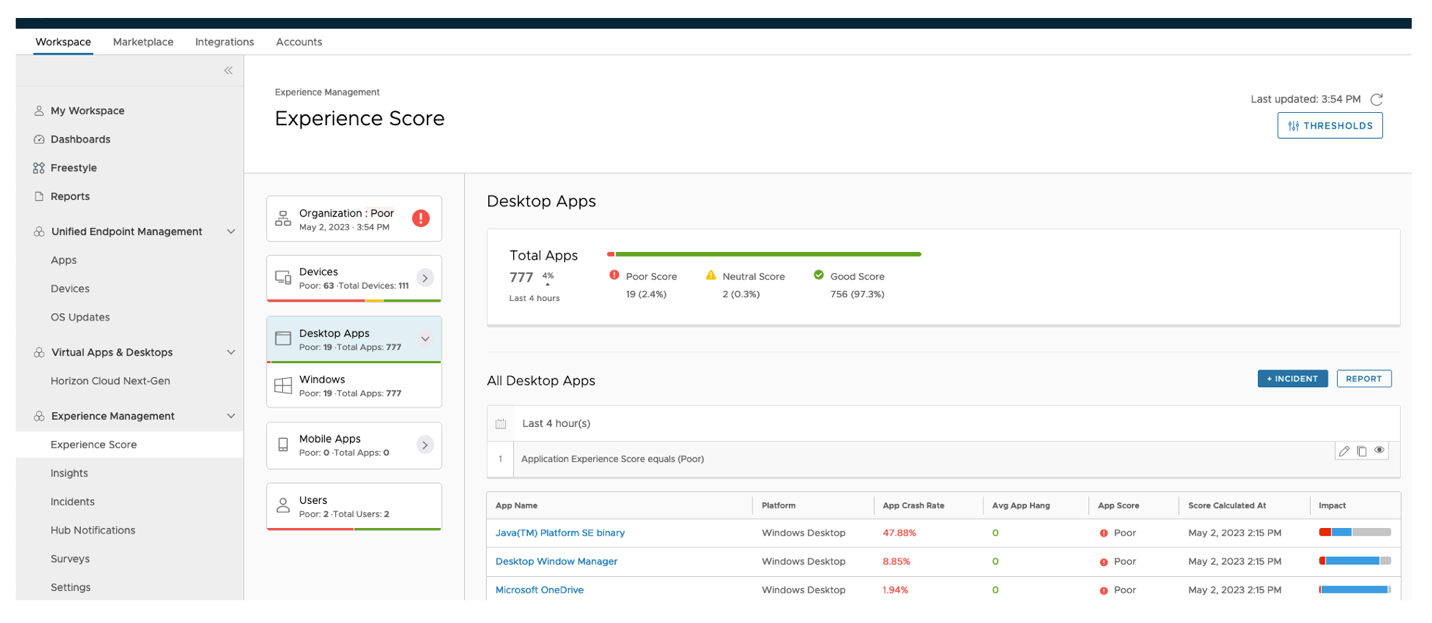
Figure 39: This customer’s Experience Score dashboard shows apps with the highest crash rate
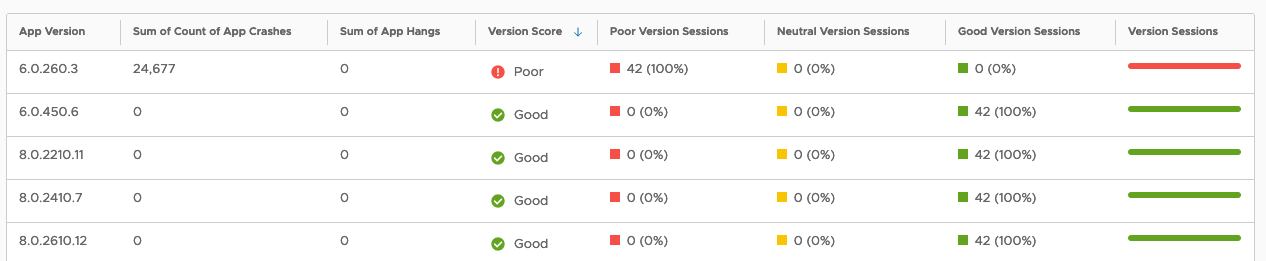
Figure 40: Drill down to view the Experience Score for specific versions of an app
The customer was also able to view which devices are still using Internet Explorer across their deployment, which is no longer supported and poses a security risk. The customer was surprised to see the extent of Internet Explorer use given it is out of support now and therefore will inform the internal application team.
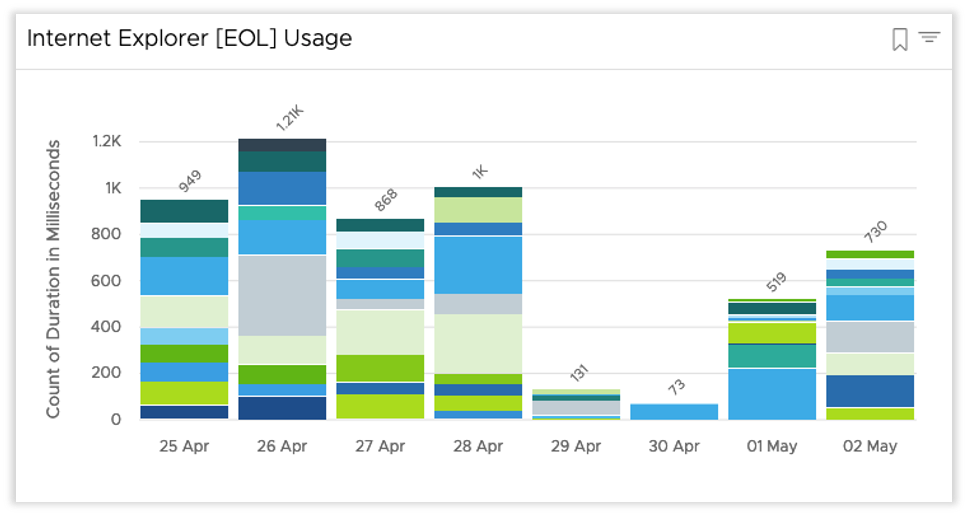
Figure 41: Leverage Omnissa Intelligence to analyze app usage, find end-of-life apps or unsupported versions
Within hours of enabling Experience Management, this financial customer was able to gain critical visibility across the device deployment and identify causes of poor user experience. Now the team had the data required to justify hardware investments and operational changes. In addition, this customer set up automated alerts to proactively support end users, such as high memory utilization and OS crashes.
Seeing value in 2-4 weeks
Within a couple of weeks admins should start to feel comfortable with the console and how to navigate around easily. In the next example, an admin who had been using the Omnissa Intelligence platform for a couple weeks found some critical information around high app crash rates and was able to investigate.
Arlo is an admin at a large enterprise company, but he also directly supports the executive team. He heard from an executive assistant that the CFO was having an app issue while on conference calls in the executive briefing room, and that was all the information provided. Arlo decided to look at the Experience Score for desktop apps where he found a specific app that has had over 20 thousand crashes in the last 7 days.
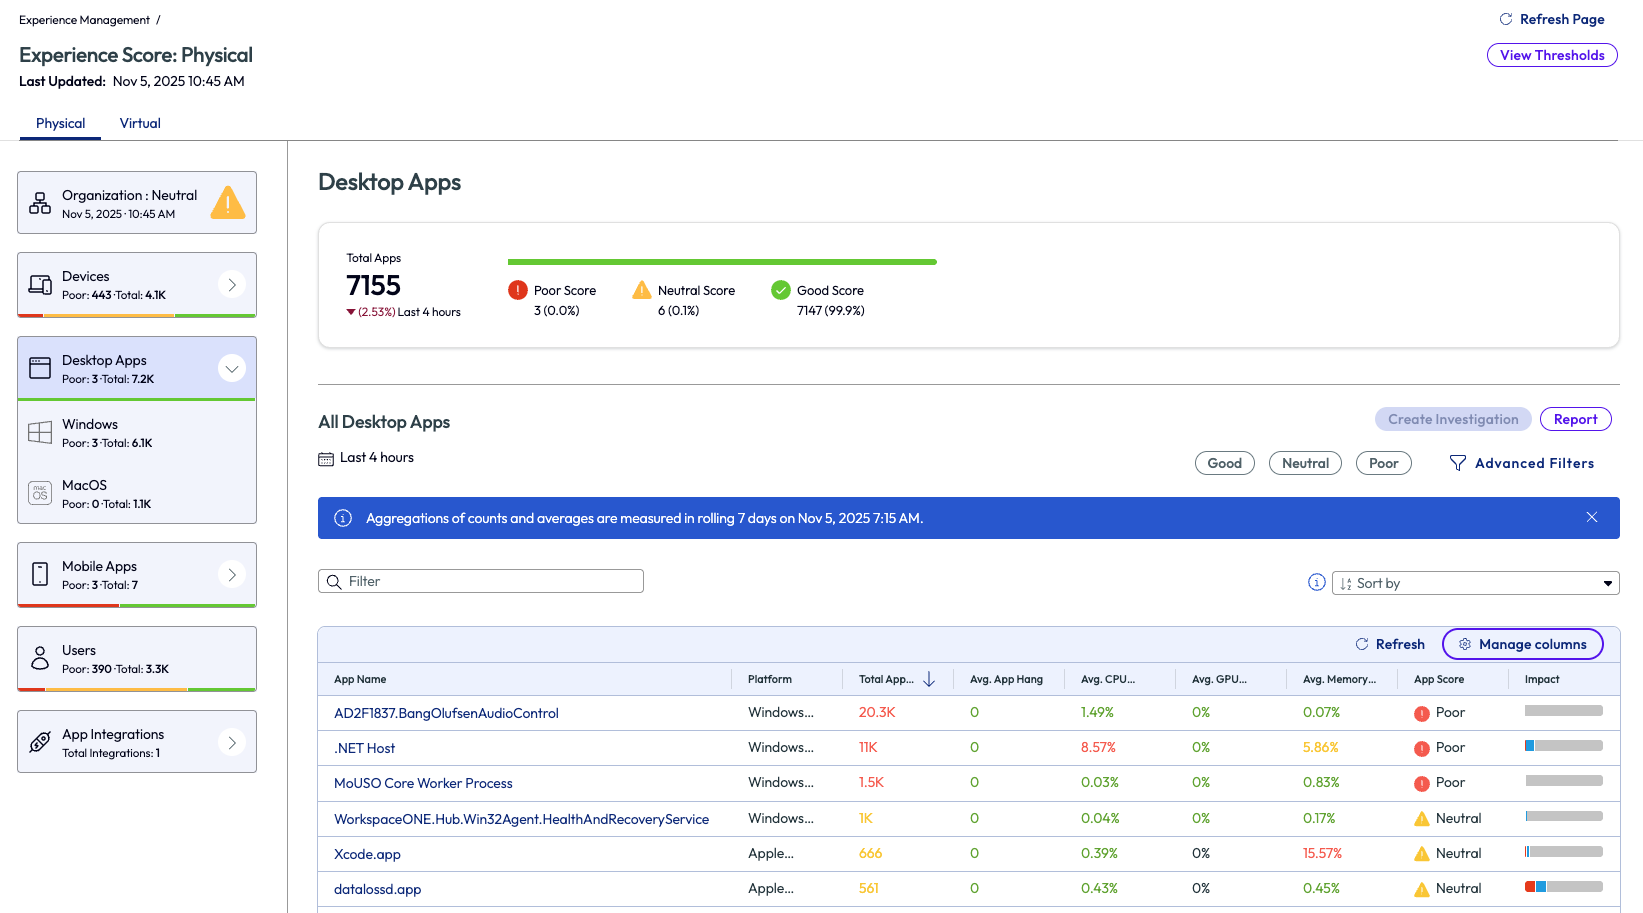
Figure 42: Experience Score of desktop apps sorted by highest total app crashes within previous 7 days
To investigate further, Arlo clicks into this app and finds that the current app version installed is 1.51.329.0. After a quick check on the vendor’s website, he discovers there is a new version available - 1.62.227.2.
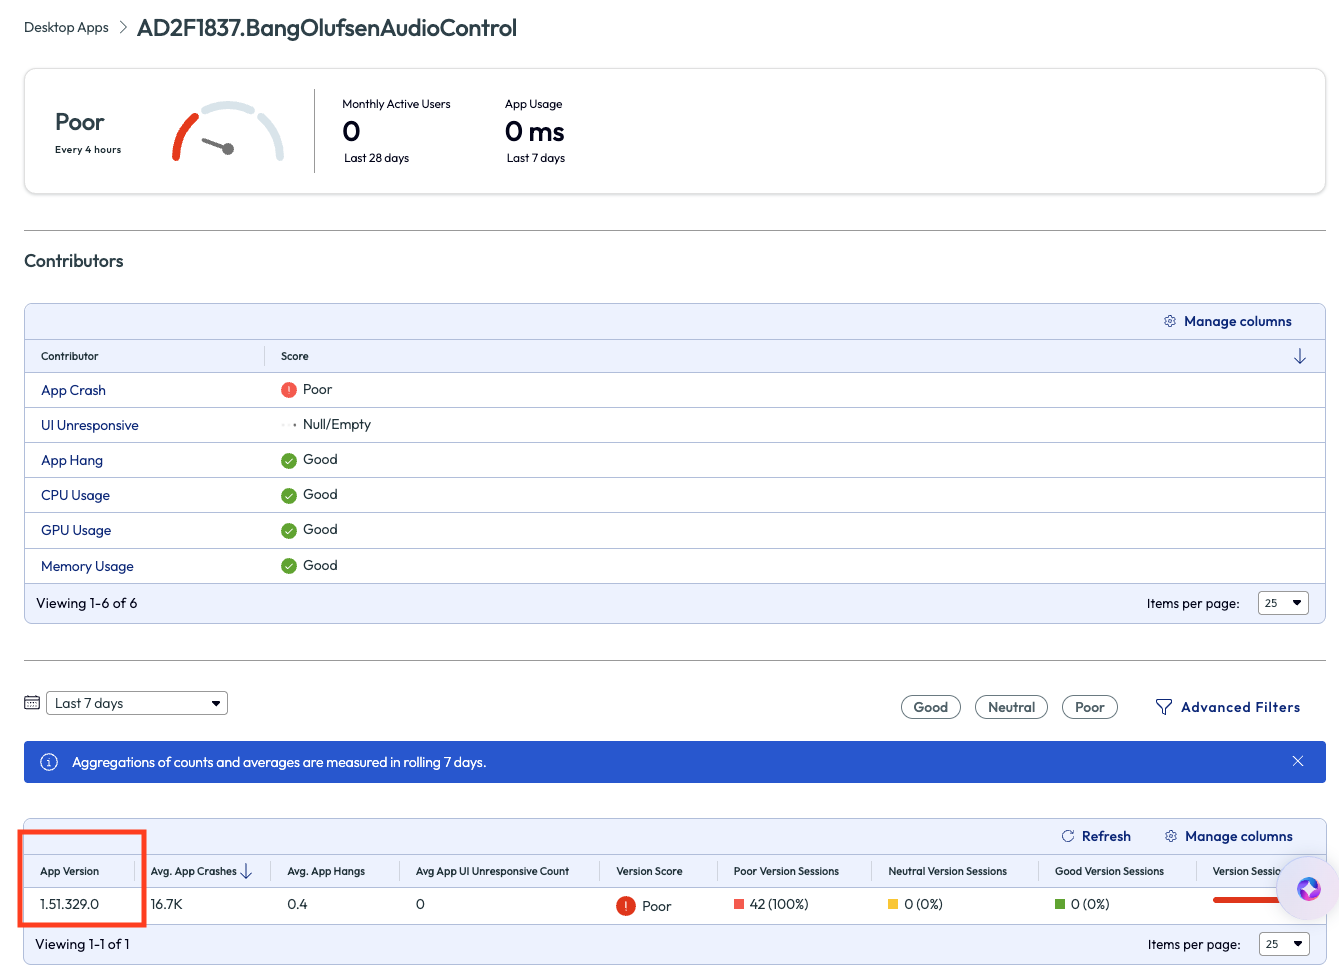
Figure 43: App crash data for BangOlufsenAudioControl app that highlights app version
From here, it is an easy fix. Arlo downloads and tests the new version of the software with the conference room’s speakerphone and finds no issues or crashes. Using this stable app version, he packages it up in Workspace ONE UEM and deploys it to the entire executive teams’ devices which share this conference room and speakerphone.
Arlo spent a total of approximately 35 mins from the issue reported to deploying a new app, with most of that time used testing before deployment. Omnissa Intelligence helped Arlo go from receiving a report of an issue, to root cause, to resolution in half an hour. This proactive troubleshooting and fast time to resolution is the power of using DEX data to help solve real-world issues.
Value within 30-90 days
Another customer, this time in aircraft manufacturing, had a deployment of 125,000 Windows devices. This customer was experiencing about 1,400 “Memory Management 1a” errors (the error logged for BSOD/OS crash) per week. The IT team had a hunch that the antivirus app was the culprit, but couldn’t prove it. The Security Team thought the cause was related to the OS version. This was a classic finger-pointing case, where MTTI (mean time to innocence) is critical.
Experience Management provided data to prove the 1a errors were happening regardless of device OS version. This data guided the customer to focus on correlating OS crashes with the antivirus app version on devices using custom dashboards within Omnissa Intelligence.
The team deployed an update for the antivirus app using Workspace ONE UEM. Then with Experience Management, the team tracked 1a errors after the app update was applied and the occurrences decreased from 1,400 crashes per week to 157 (almost 89% reduction).
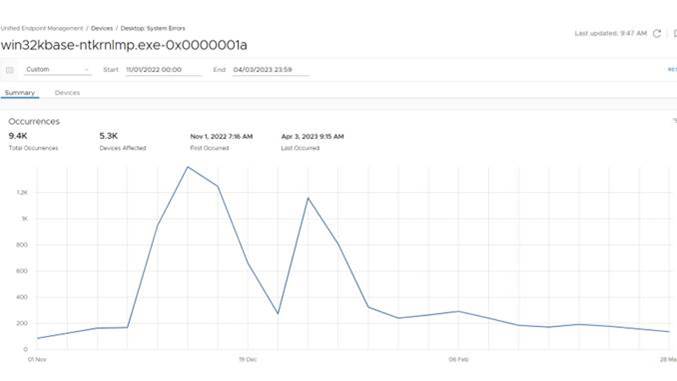
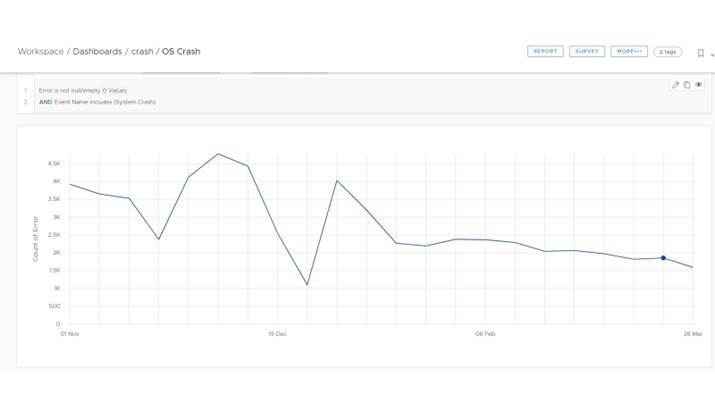
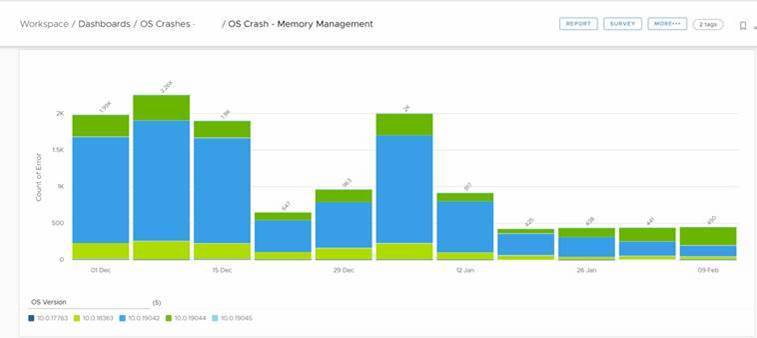
Figure 44: Omnissa Intelligence data used by a manufacturing customer to track Windows OS crash rate after applying antivirus app update
Assuming each BSOD consumed 15 minutes of an employee’s time (the end user who experienced the OS crash), 750 employee productivity hours per week were restored. This doesn’t even count any work progress that was lost and had to be recreated.
Summary and additional resources
Experience Management, powered by Omnissa Intelligence, provides the visibility required to measure and analyze employee digital experience and automate remediations. The insights derived from Experience Management telemetry provide valuable ROI for customers in all industries. Understanding the Omnissa tools, and using them properly, can help IT admins and teams use the metrics not seen on a daily basis to reduce MTTR and keep their organizations running efficiently. While this document may help you get started, feel free to review the more in-depth documents and resources on our website, similar to the ones listed below.
Additional resources
To learn more about the Workspace ONE DEX Solution, you can explore the following resources:
- Digital Employee Experience (DEX) Solution technical resources
- Experience Management product documentation
Changelog
The following updates were made to this guide:
| Date | Description of Changes |
| 2025/11/25 |
|
| 2024/10/24 |
|
| 2024/02/01 |
|
Author and contributors
This document was written by:
- Christina Minihan, Senior Manager, Product Specialists
- Cy Whitfield, Senior Product Specialist
Feedback
Your feedback is valuable.
To comment on this paper, contact the Omnissa Product Specialist Team at tech_content_feedback@omnissa.com.