

Experience Management evaluation guide for virtual
Introduction
The modern work environment often includes multiple virtual structures and virtual users, and it can become messier the bigger the organization. While virtual work environments can save on costs for companies, it can also introduce some blind spots of lost performance and lost time. Omnissa Intelligence helps regain some of this loss by providing insightful aggregated telemetry from Workspace ONE UEM and Horizon deployments. Using this information, organizations can make more educated assertions of an environment and remediate issues that were previously unseen.
With the Experience Management add-on, there is a lot of telemetry and data to dig through. This guide will walk through real-life use cases from a new deployment to highlight the evident ways to see ROI. While there are many features and use cases, this guide is intended to help admins begin to understand how they can use Experience Management to realize the value in their deployment.
Realizing value out of the gate
With the Experience Management feature enabled, it’s time to jump into the first use case. The first one will be an example of low-hanging fruit that any admin can set up on the first day with Experience Management turned on.
Use case 1: Alerting on expiring certificates within 14 days
Admins know how important certificates are for users and sessions. Without valid certificates, users are rendered useless and unproductive, so renewing these is highly critical to the business. This use case shows how one organization prevents this from happening by automating a ServiceNow (SNOW) ticket for any certificate that is set to expire within the coming two weeks.
Starting with a new workflow, the admin named it Alert on Expiring Certificate (14 days out) and chose the Horizon connector category. Within this choice, the admin selected Connection Server General Information as the data source.
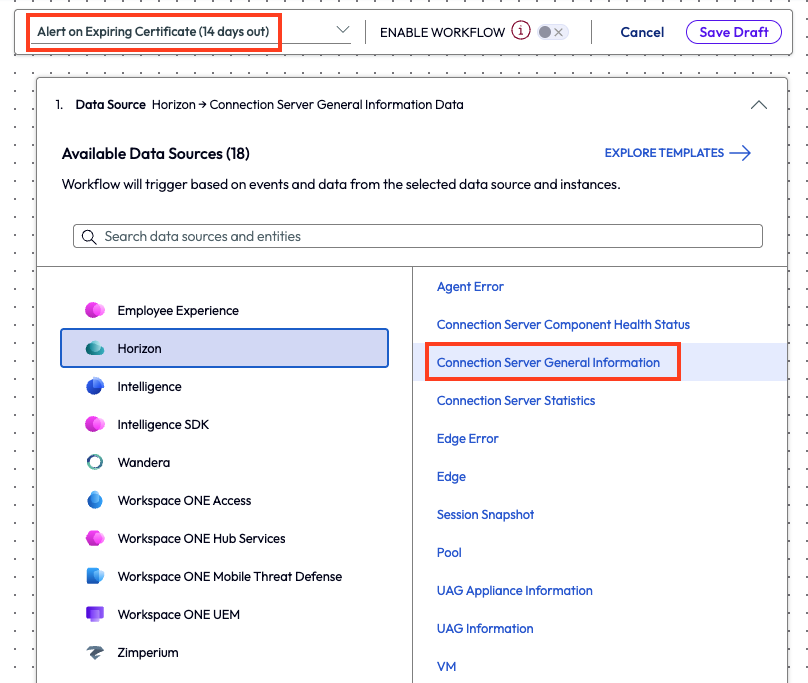
Figure 1: A new workflow with the name and the data source highlighted
After setting the trigger settings to automatic, the admin chose the filter of Certificate Expiration Time and set the parameter to before Next 14 day(s). This filter will catch all expiring certificates in the coming two weeks.
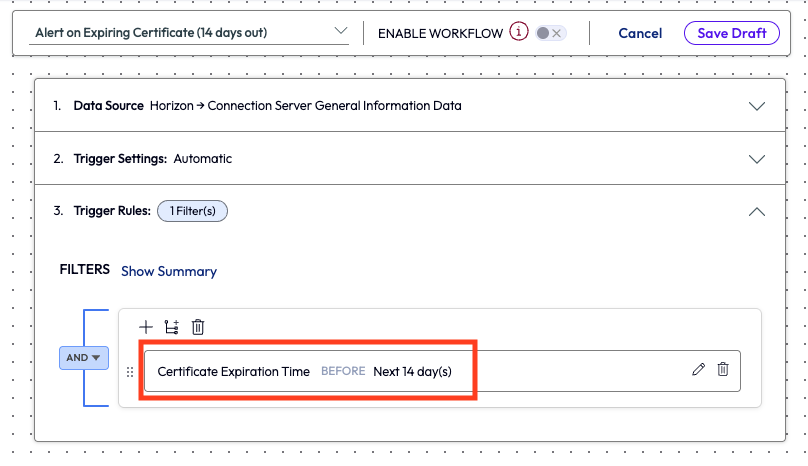
Figure 2: Trigger rules filter of Certificate Expiration Time set to before Next 14 day(s)
The next step was to create a SNOW ticket by adding the appropriate action to the workflow.
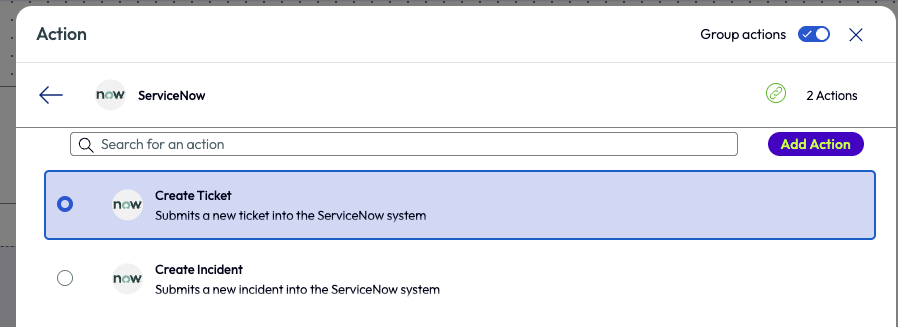
Figure 3: New action added to workflow to create a new SNOW ticket
Lastly, the admin set up the ticket to include helpful information. Once the ticket comes into the support team, they can help renew the certificate for the user.
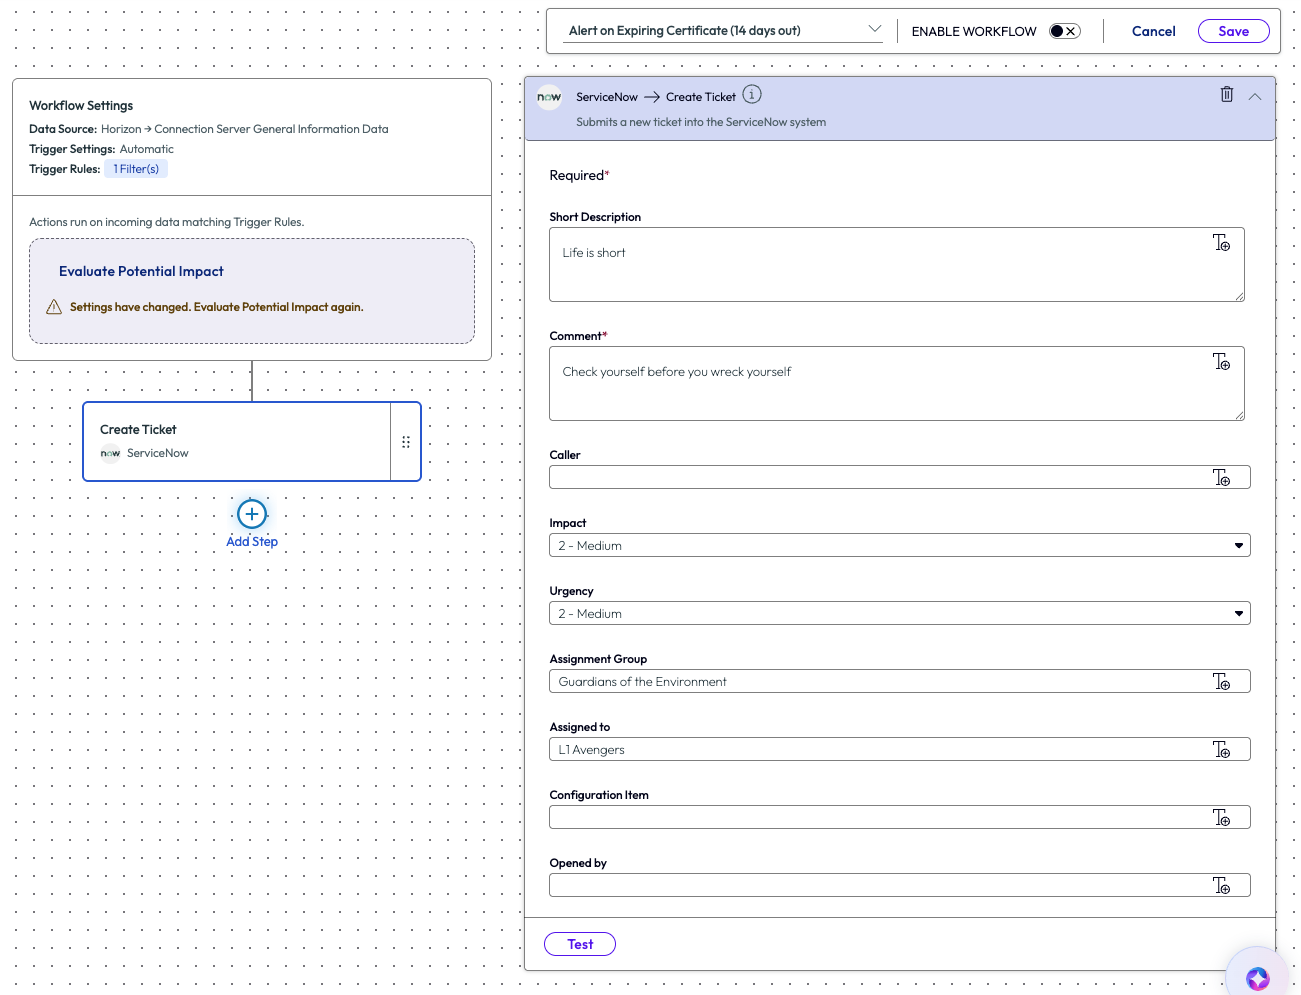
Figure 4: Parameters for creating a SNOW ticket within a workflow action
It’s a short, simple use case – but if it’s forgotten during the manual processes, the consequences can be significant. Automating these tasks gives support teams confidence that no future certificate expirations will be missed. The ROI on this simple use case is apparent and, as seen here, easy to set up.
Use case 2: Horizon poor session experience with high average memory usage
Not all things are under an admin’s control, but that doesn’t mean the Experience Management tool can’t be helpful to the organization. Looking at the bigger picture and narrowing down the root cause for other teams can be beneficial to those teams and the company, as will be discussed in this example.
The admin in this use case wanted a clear, high-level view of how the entire organization was performing. They clicked on the Organization Overview option from the left pane and was led to a grouping of pre-built widgets. This overview dashboard surfaces user experiences so admins can understand status instantly. The first thing that stood out was that the Virtual Session Experience for the organization had a poor score.
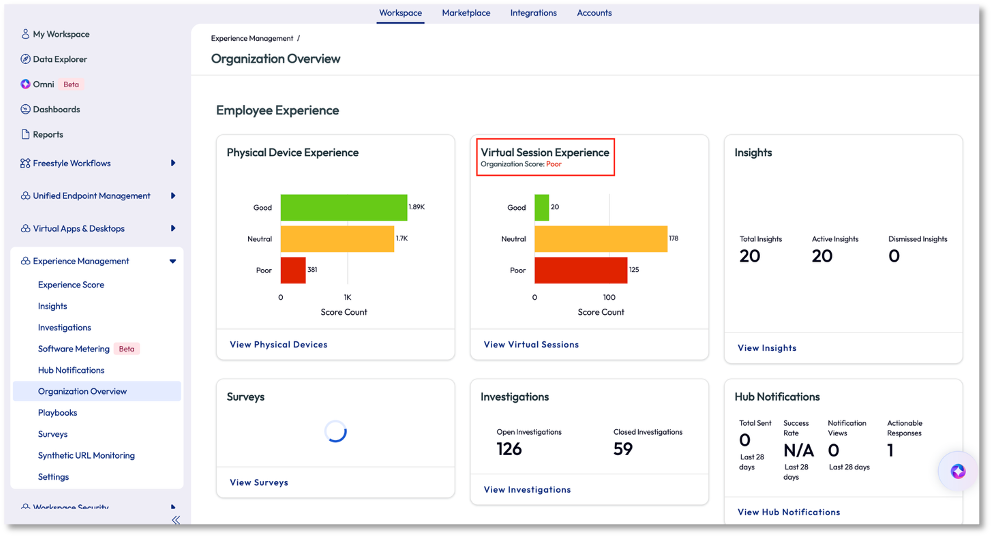
Figure 5: Organization Overview page
The admin clicked on View Virtual Sessions on the widget to investigate further. On the next page, the admin immediately knew the experience was poor, not just because of the score but because of the consistency of the red in the charts of the widgets. Over the last 4 hours the score was poor, as seen in the first widget with the gauge, but more importantly is that on the 7-day rolling average the poor score had been persistent.
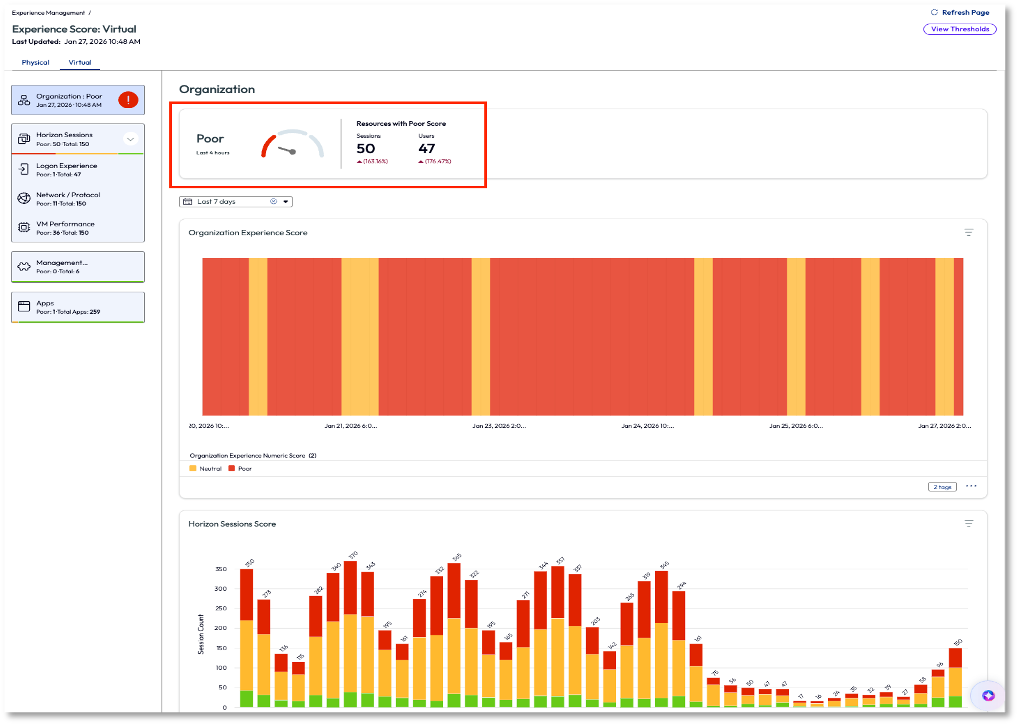
Figure 6: Virtual experience score page with poor scores highlighted
On the left pane again, the admin clicked on the VM Performance option to pinpoint what was driving the poor score. This page lists the contributors to the poor score in descending order. Although not the highest reason, the admin decided to look into the Memory Usage contributor as it has been an issue in the past for their organization.
Note: In the next few screenshots, the ability to view the thresholds for different experience scores is available by clicking on View Thresholds on the top right. Clicking on an individual widget for an experience score will allow adjustments to be made.
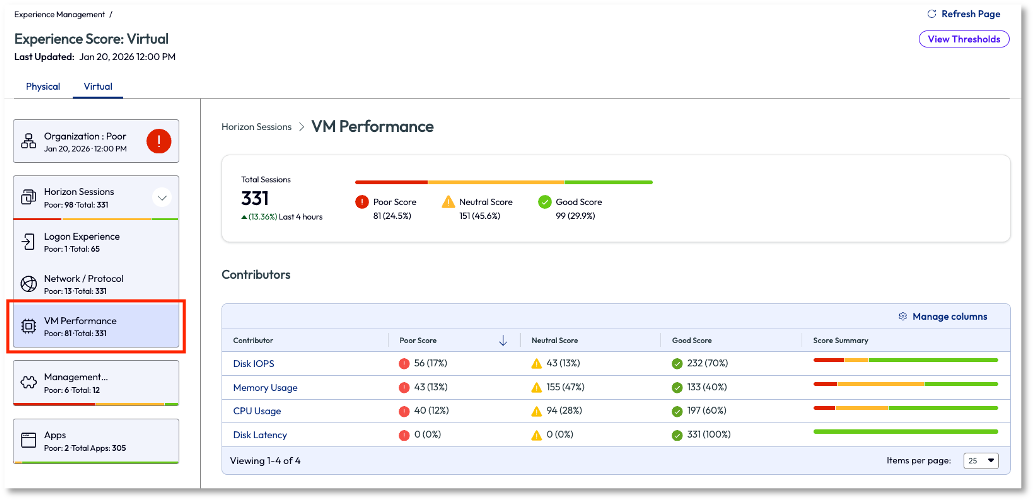
Figure 7: VM Performance dashboard that shows a list of contributors for the experience score
In Figure 8, the session count of average memory consumption score was displayed, broken into 4-hour intervals over the previous 24 hours. The admin looked to the list at the bottom of the page to see top sessions with high average memory usage listed, again, in descending order. This prioritizes the most impacted users first, ensuring they are addressed promptly.
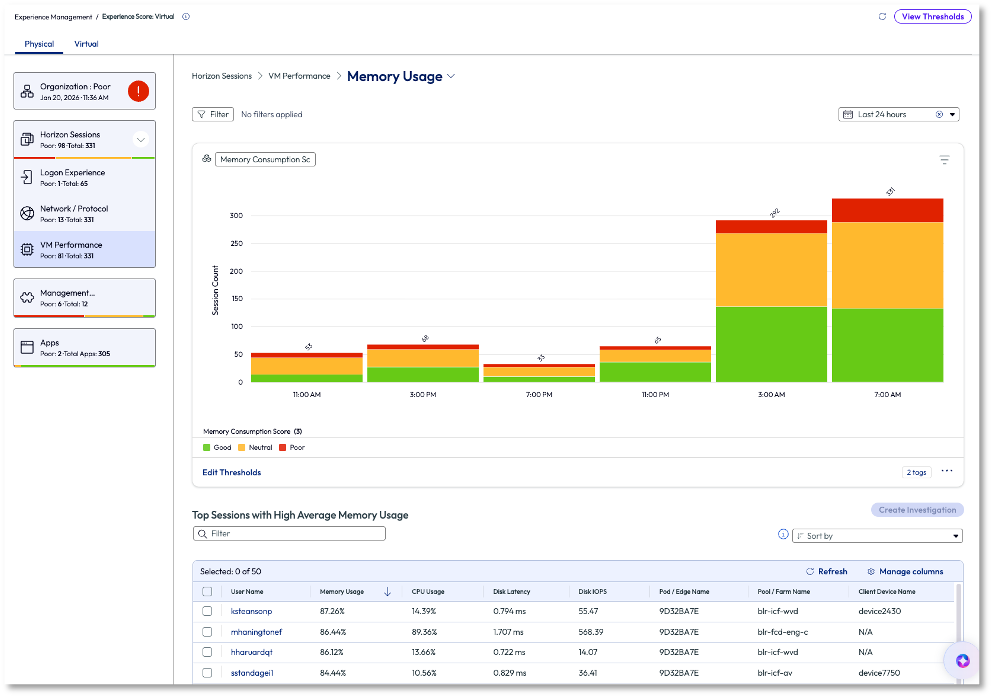
Figure 8: Memory usage for VM Performance over the past 7 days
Next, the admin clicked into the top username on the list, ksteansonp. Details around this session opened, and it was obvious that memory was consistently running at a high capacity of around 94%. This high usage was a major contributor to the poor user experience.
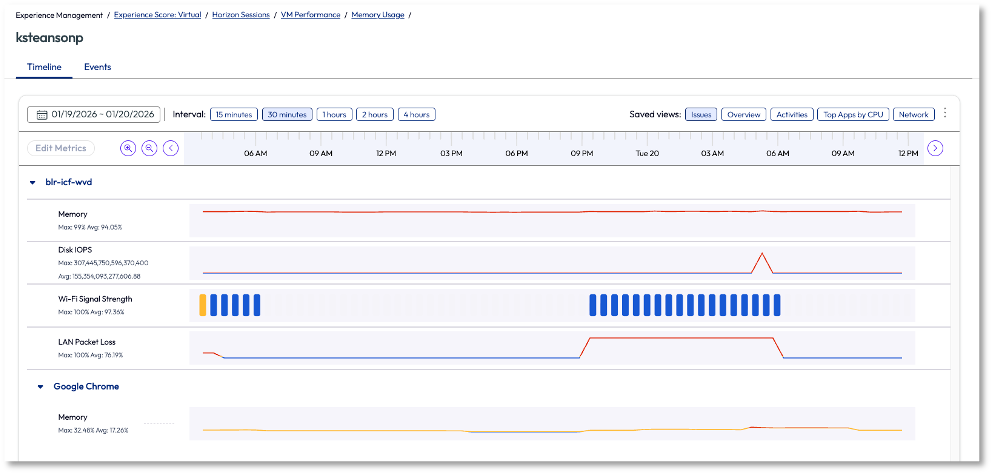
Figure 9: Memory usage for ksteansonp’s session, in timeline view
The admin was able to identify an issue for adjacent teams to investigate further, but with proof of poor experience. This is more than just an email that tells another team something is wrong; this is proof via data to substantiate the claim. The admin went back to the previous page and selected the username with the top session from the list and began an investigation.
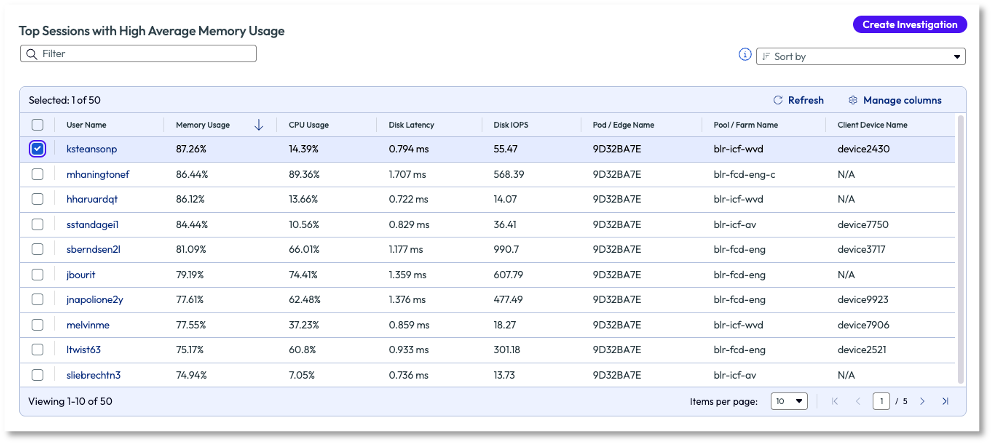
Figure 10: List of top users with VM sessions that had high average memory usage, sorted in descending order
After naming the investigation, the admin searched the list of available playbooks that might be helpful to this issue. They were able to share the investigation with the appropriate Horizon team to troubleshoot and remediate. The admin did this to monitor the investigation and see how the resolution affected the experience score. While this use case doesn’t show an immediate remediation to the issue, it does show how the available data in the Experience Management tool helps identify issues and how it can be passed to adjacent teams. Also note, in the previous screenshot, Figure 10, multiple or all sessions can be selected to investigate a large-scale issue.
Use case 3: Alerting for Horizon sessions with poor Wi-Fi and poor WAN
Virtual work is great – if it works. When the connection is slow or the signal is weak, the entire experience and usefulness of virtual work is in question. This example shows exactly this issue. An organization just rolled out Experience Management to their environment and wanted to investigate some tickets that came in about slowness for some of their remote colleagues.
The admin opens the Omnissa Intelligence tool and clicks on the Horizon Operations Overview feature. Again, this is a dashboard with widgets pre-built to specifically monitor a virtual tenant and provide valuable information. The admin scrolls through the widgets and finds a pertinent widget at the bottom named Wi-Fi Average Signal Quality. Clicking view on the widget opens into the full widget with additional information.
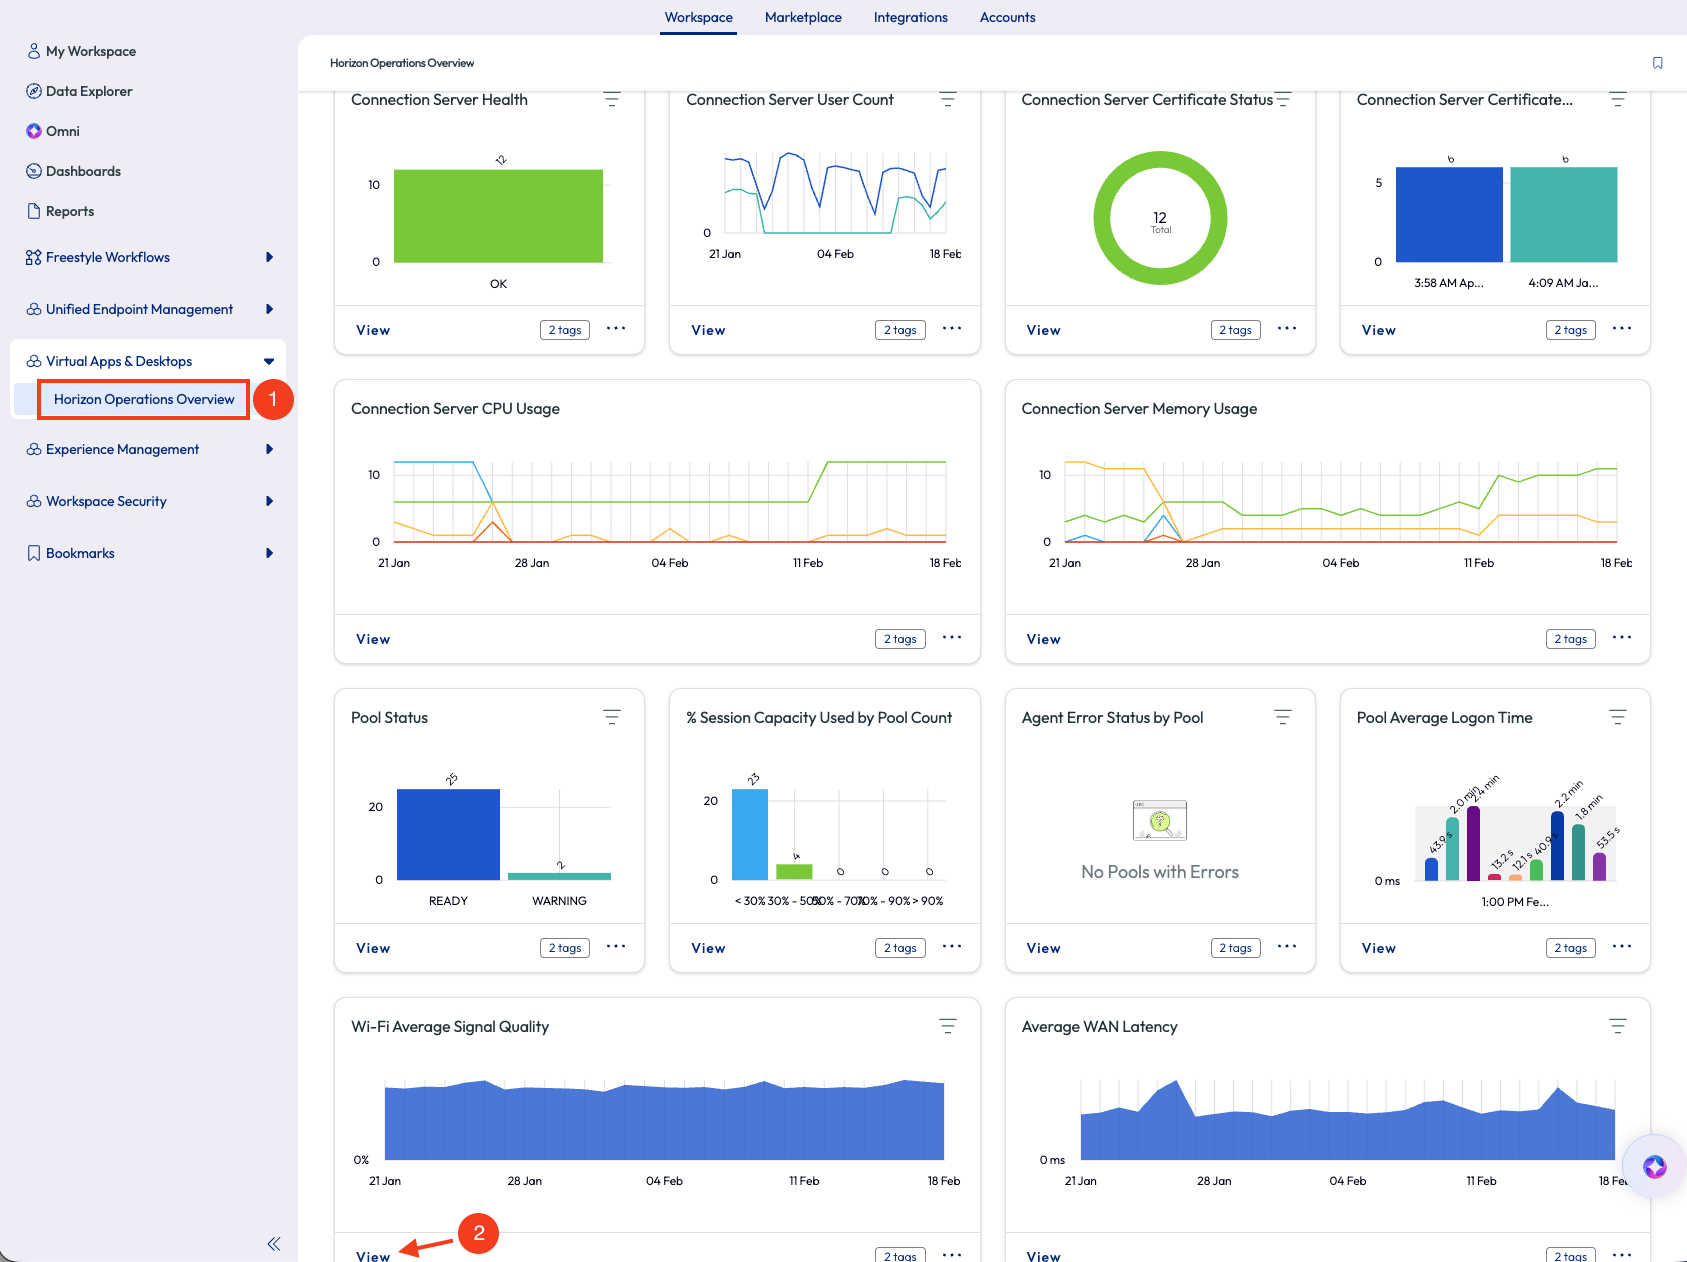
Figure 11: Horizon Operations Overview dashboard page
On this page, the admin saw a column named Client Wi-Fi Signal Strength and sorted the values ascending. As all good admins know, a Wi-Fi signal strength with a low rating means the signal is bad, specifically the closer it is to -90 dBm the worse it is. At the bottom of the scale, -90 dBm is essentially unusable. Slightly less than this amount can be just as tragic to experience and productivity.
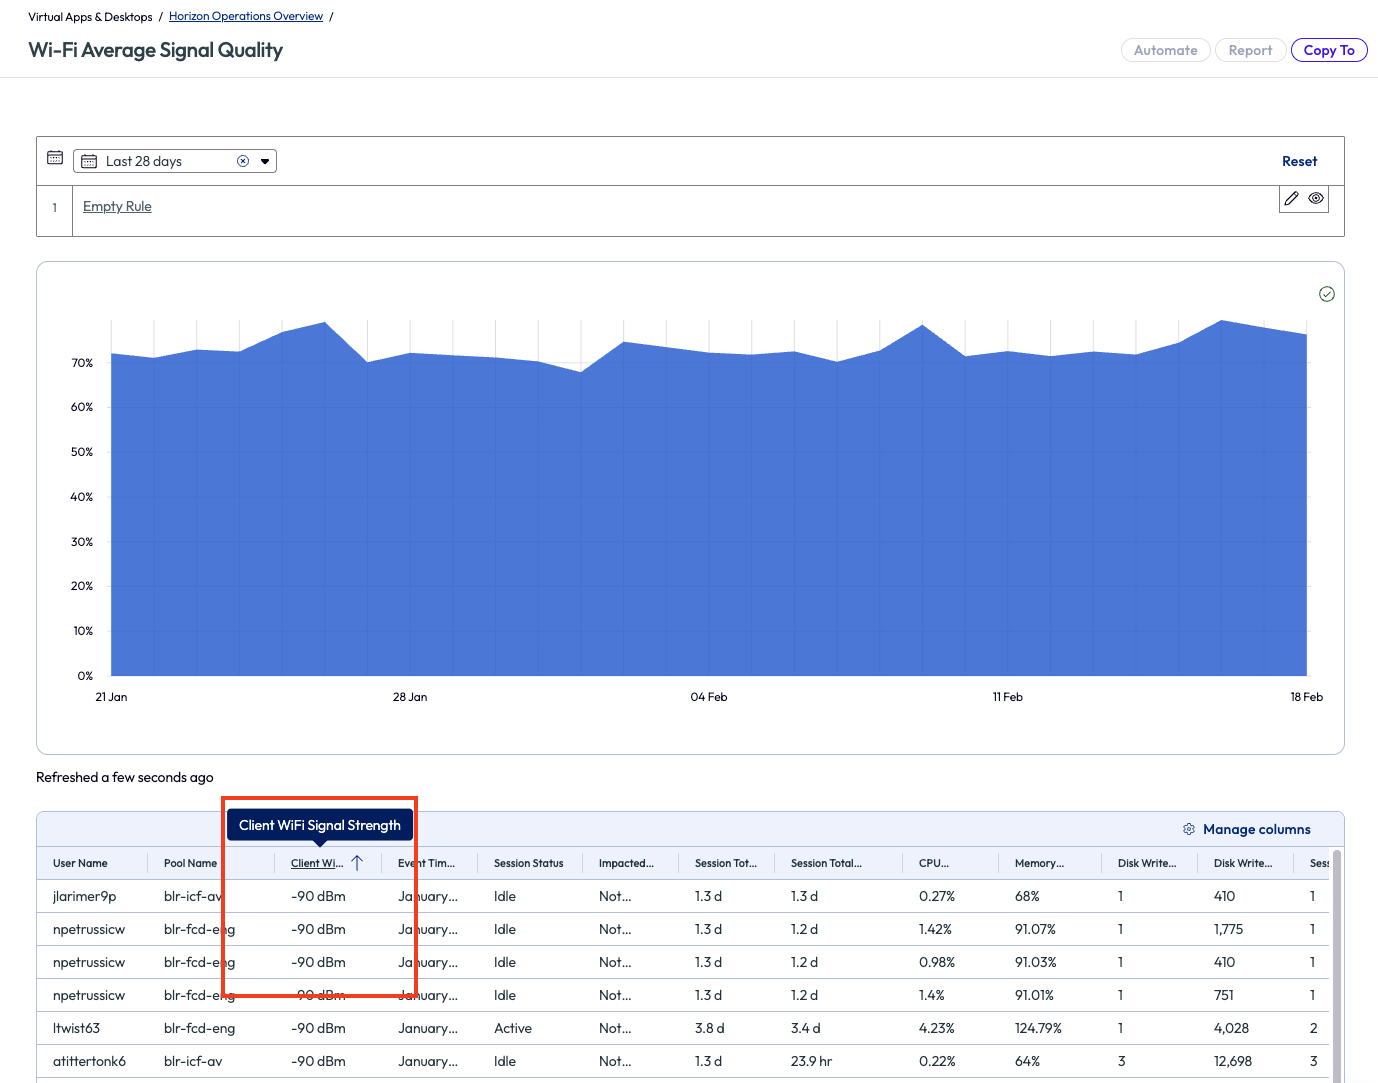
Figure 12: Wi-Fi signal strength with list sorted ascending
Seeing that there were multiple colleagues with a score this low, the admin decided to act on clients that had fallen into a low signal strength range. The admin opened Freestyle Workflows, clicked on General on the left pane, then added a new workflow from the top right of the page.
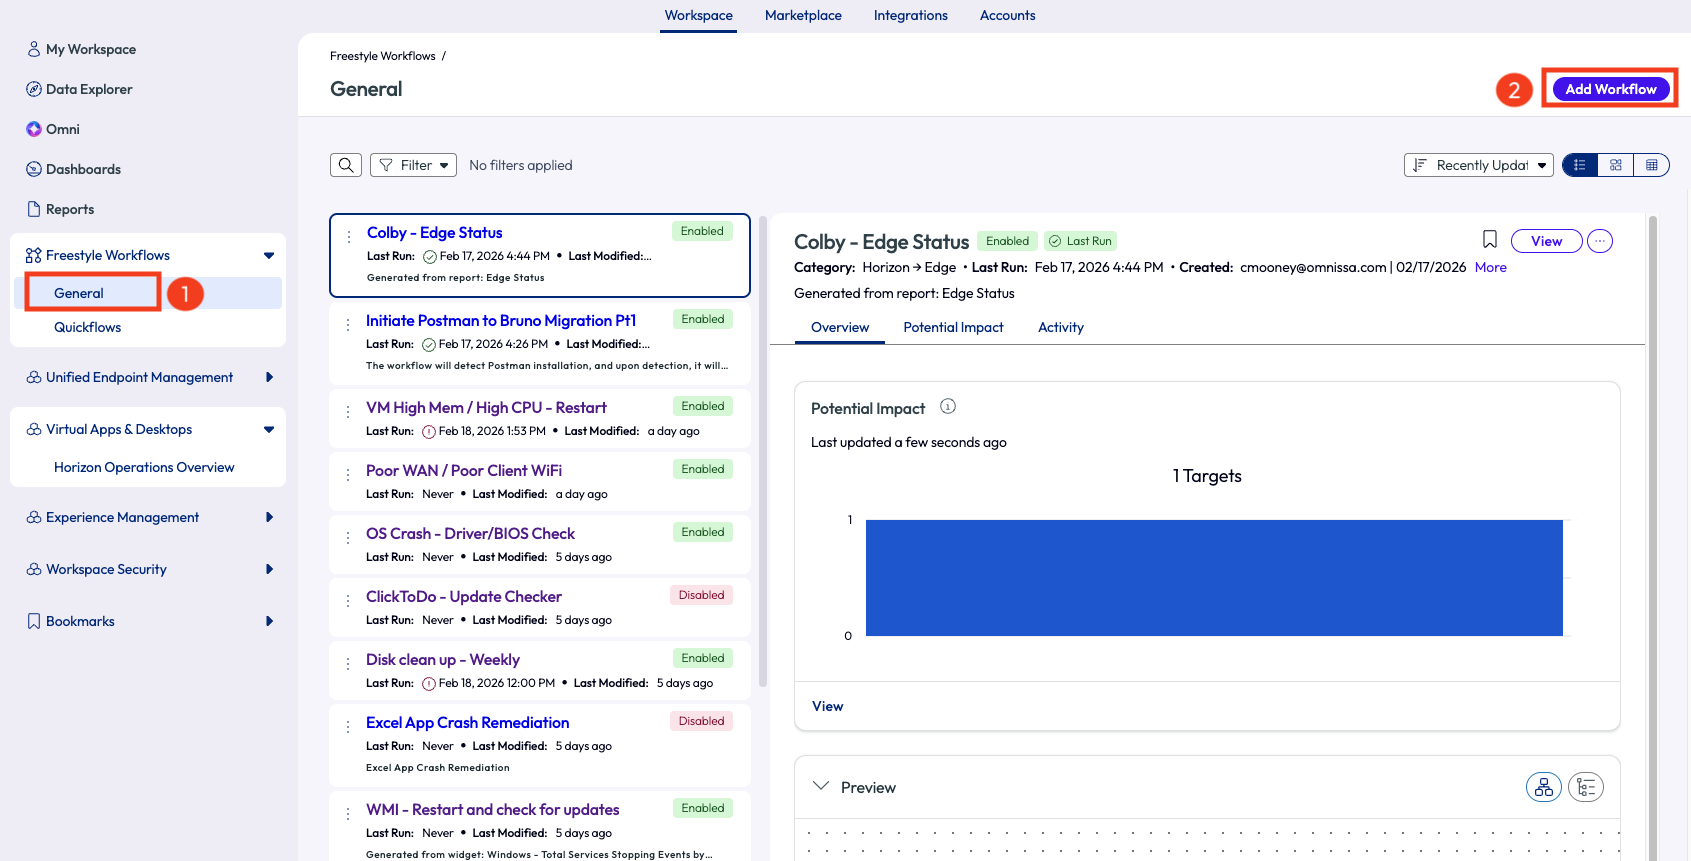
Figure 13: Page to add a workflow
The admin began the workflow by giving it a name: Poor WAN / Poor Client Wi-Fi. As a data source, they selected Intelligence > Horizon Session Experience Score. The metrics from this data source provided insight into what was impacting the experience score of the entire Horizon environment.
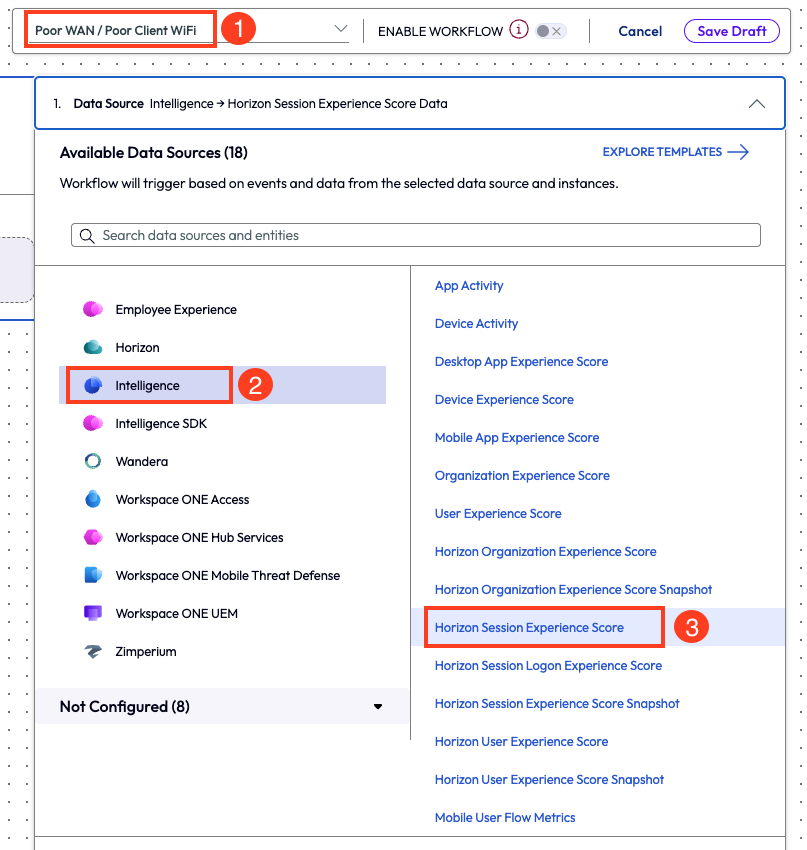
Figure 14: Named workflow, selected connector, and selected data source for a new workflow
The admin left the trigger settings as automatic and set up the trigger rules next. By adding a filter for Client Wi-Fi Signal Strength, the environment returned over 500 potential results, which was visible by clicking the Evaluate Potential Impact option on the workflow designer.
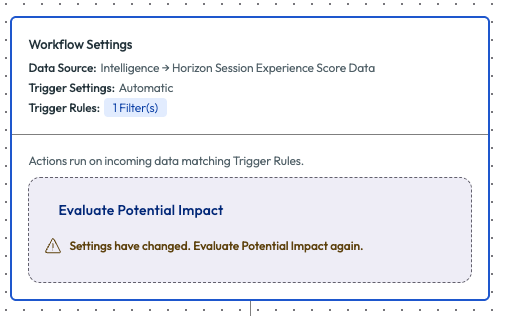
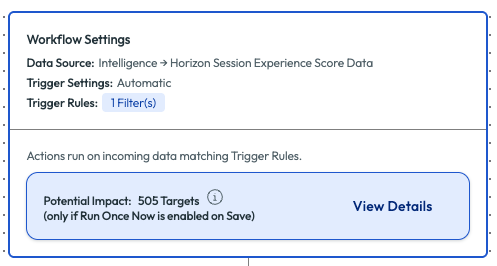
Figure 15: Workflow with potential impact and potential targets showing
This would be too many results to try to tackle right away, so the admin also added in WAN Latency Score as a filter to narrow down Poor results to address the worst experiences first. After adding this second filter, the admin re-evaluated the potential impact to find only 8 targets.
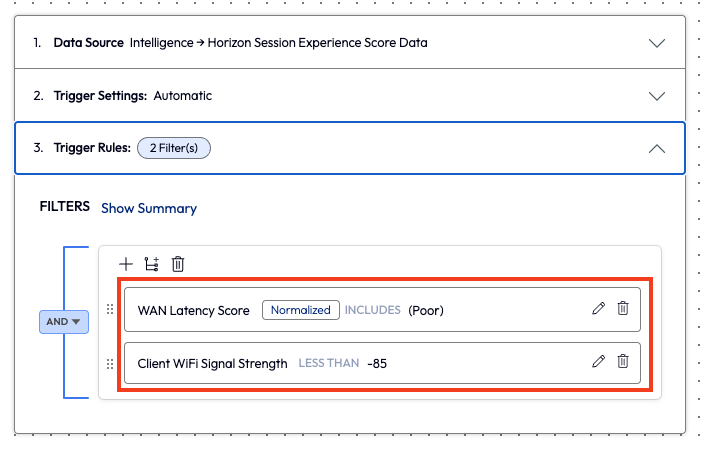
Figure 16: Filters for WAN Latency Score and Client Wi-Fi Signal Strength with values set
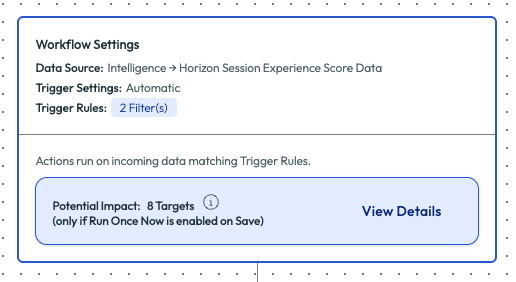
Figure 17: Updated potential impact that shows 8 targets
The admin clicked the View Details option to see more information about these 8 targets. Almost immediately, the admin noticed that 7 of the 8 potential results were for the same user. Addressing one user at a time seemed very feasible at this point, but the admin wanted to keep an eye out for this exact issue in the future, hence the need for the workflow.
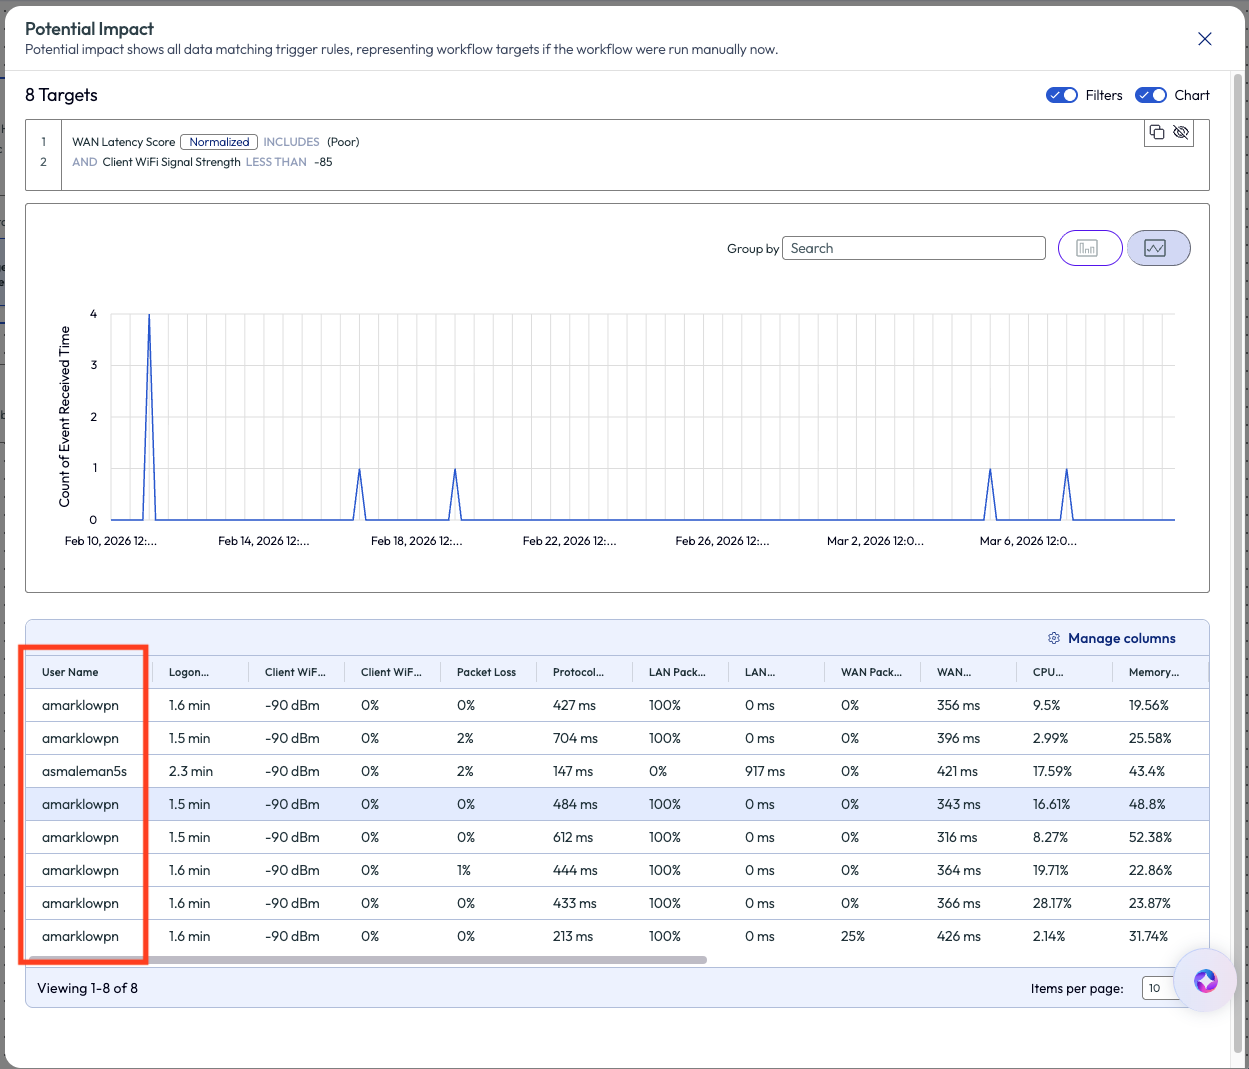
Figure 18: Potential impact of 8 targets with the User Name column highlighted
With targets identified, the admin then added a remediation step to the workflow by clicking on Add Step. On the actions pop-up panel, the admin selected the Slack Web API connector and chose the option to send a message.
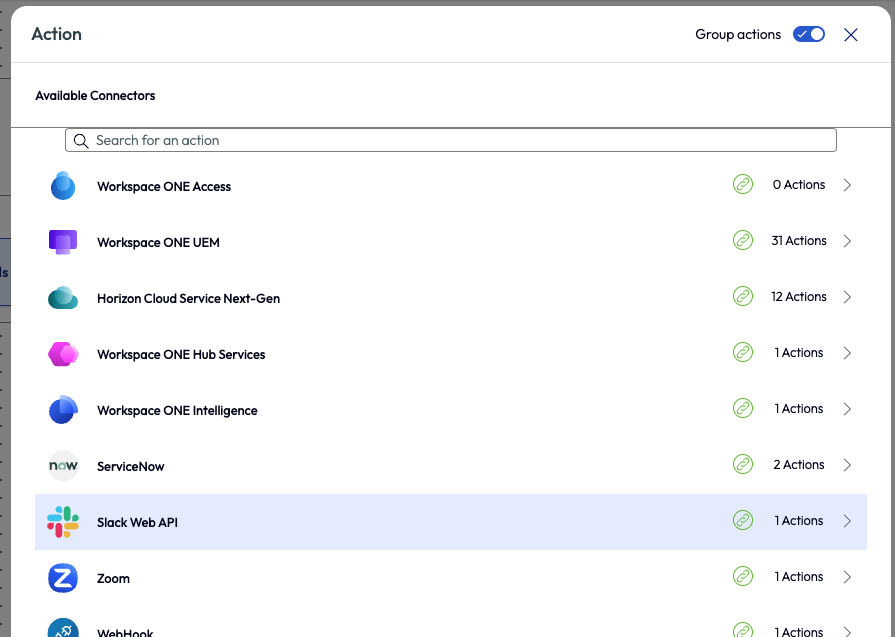
Figure 19: List of available connectors for an action on a workflow
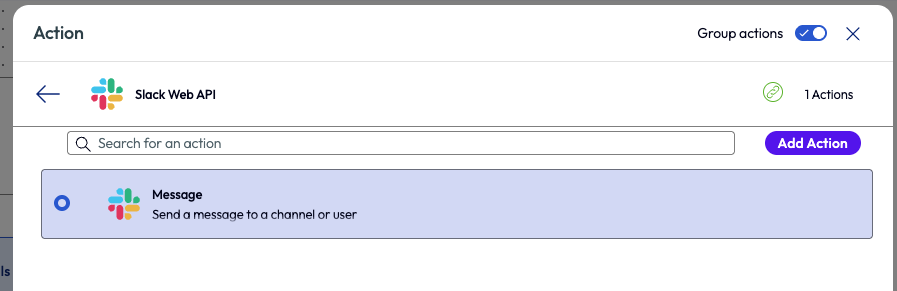
Figure 20: Slack action to send a message
The admin filled in the information for the required ticket creation fields, then saved and enabled the workflow in the top right of the page.
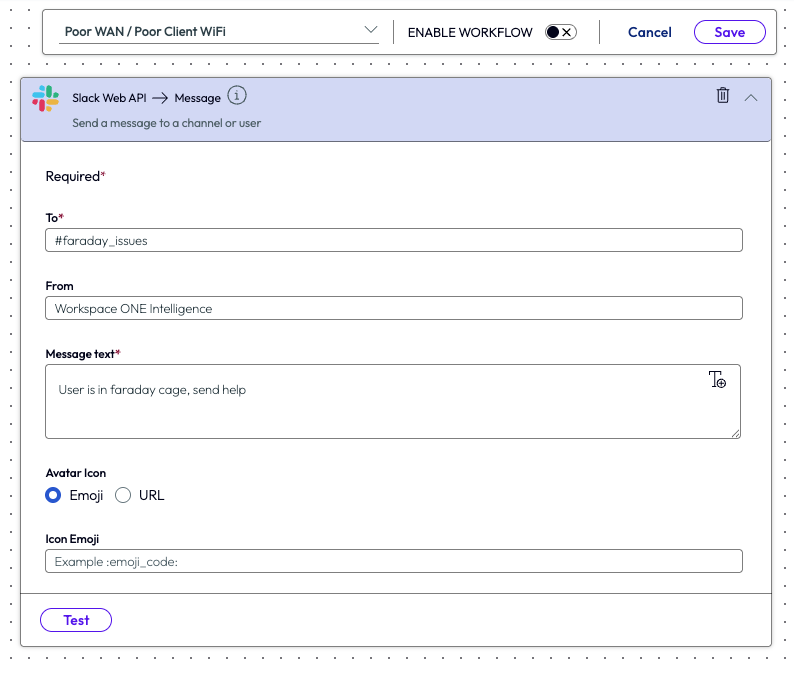
Figure 21: Create new message page for Slack
With this workflow in place, any colleague experiencing poor WAN latency and having a very low, nearly unusable, Wi-Fi signal strength would automatically have an alert sent to a specific Slack channel on their behalf. The admin reached out to this individual and was able to troubleshoot and resolve their poor network experience. Now aware via the Slack channel, the support teams could proactively reach out to colleagues to start remediation for this issue. This move from reactive to proactive support for poor experiences showed end users that the IT team was paying attention and cares about their individual situations.
The ROI was obvious to the leadership team because it showed how slow experiences that were either not reported or not seen by the IT team before were now top of mind and were being resolved. Working to fix slowness is always a win for a fast-paced company in a fast-paced world.
Use Case 4: Preventing weekend overtime work
The United States has a reputation for working a lot, and sometime a bit too much. So, while it may be common practice in America to work overtime in many industries, not all countries find this appropriate. This use case follows how an admin of a European organization prevented remote workers from logging any weekend work and causing the company to pay overtime to these employees. This use case is rooted in helping employees get the well-deserved weekend breaks they deserve; it is not based on the organization trying to save a few dollars, even if that was one of the outcomes.
The admin created a new workflow and named it Friday Night – take pool offline, straightforward naming to keep it simple. After selecting the Horizon data source of Pool, the admin selected trigger settings to be scheduled weekly for Friday nights at 11:50pm.
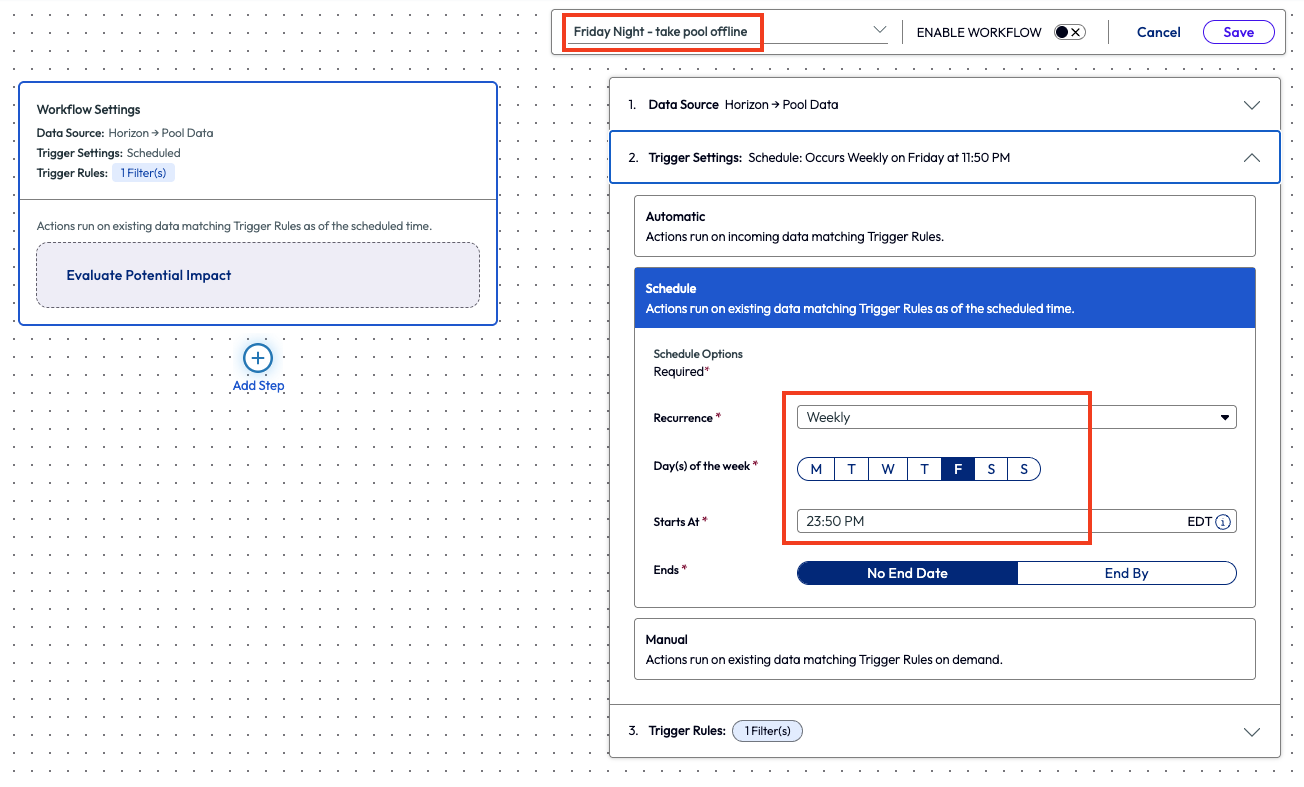
Figure 22: New workflow named Friday Night – take pool offline, showing the set schedule for the trigger settings
The admin filtered the trigger rules by selecting all the available pool names, 27 in total.
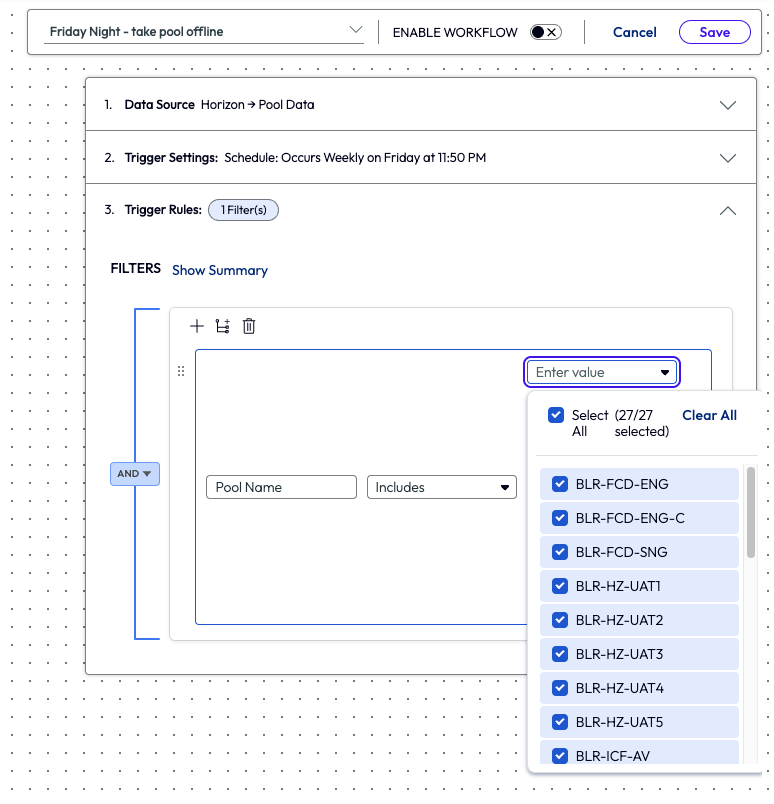
Figure 23: Workflow showing the trigger rules and 27 (all) pools selected
Next, the admin added an action to the workflow and selected Take Pool Offline within the Horizon Cloud Services Next-Gen connector. This option temporarily disables a desktop pool to prevent new user connections.
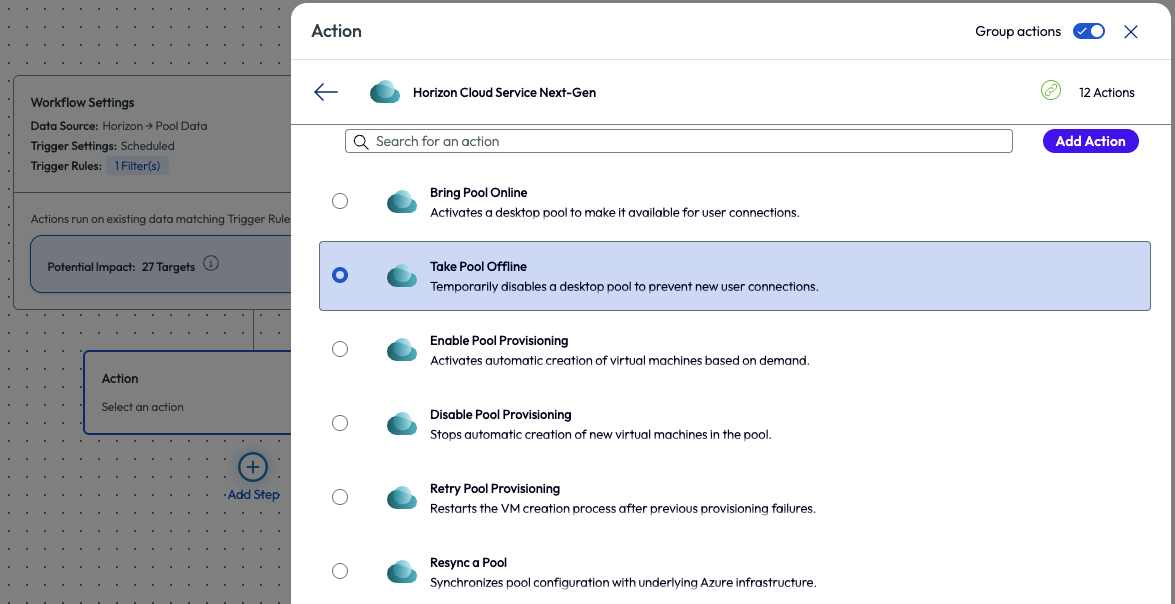
Figure 24: Action step Take Pool Offline within Horizon Cloud Service Next-Gen connector selected,
The admin saved this workflow and created a new one to shut down the VMs. The reason for creating a new workflow was to give a few minutes for the first one to process the pools before the second workflow kicked off. After naming the new workflow Friday Night – shut down VMs, the admin selected the trigger settings to run at 11:55pm on Friday nights.
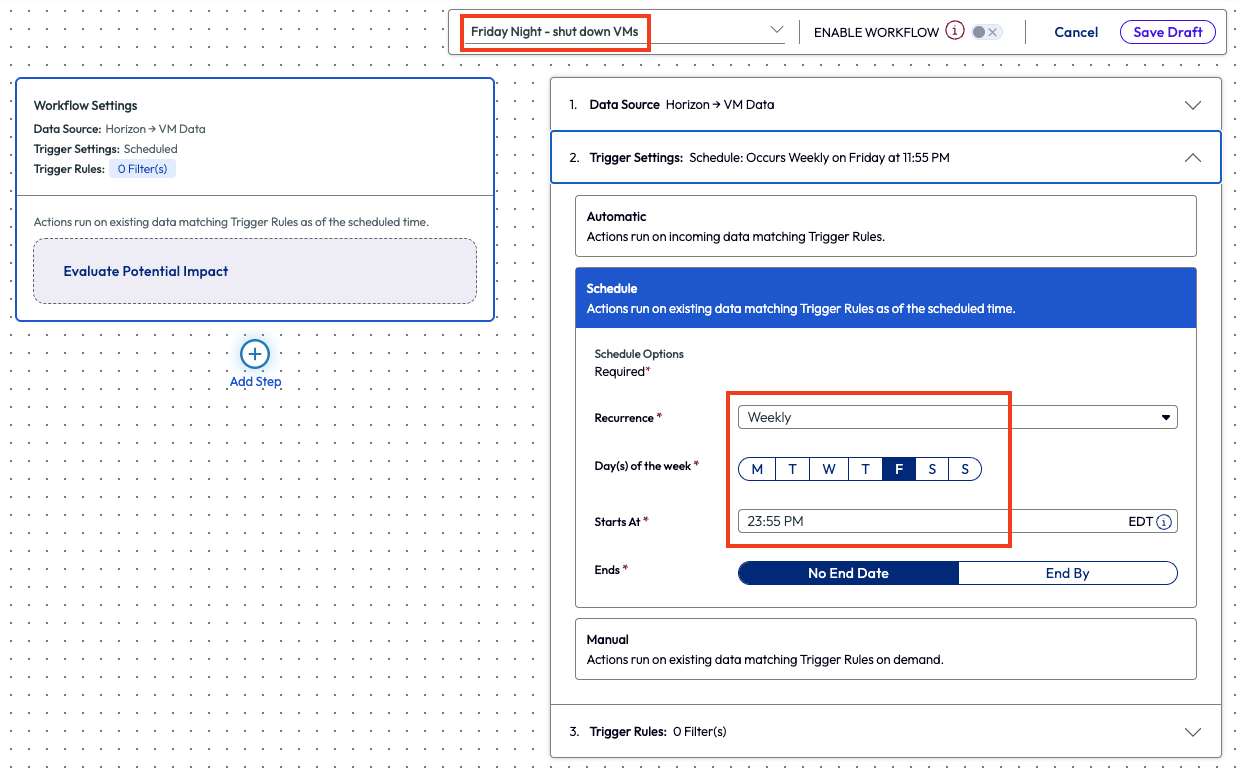
Figure 25: Named workflow and schedule selected for 11:55pm on Fridays
The admin selected all VMs from the trigger rules under the attribute VM ID, all 100 of them.
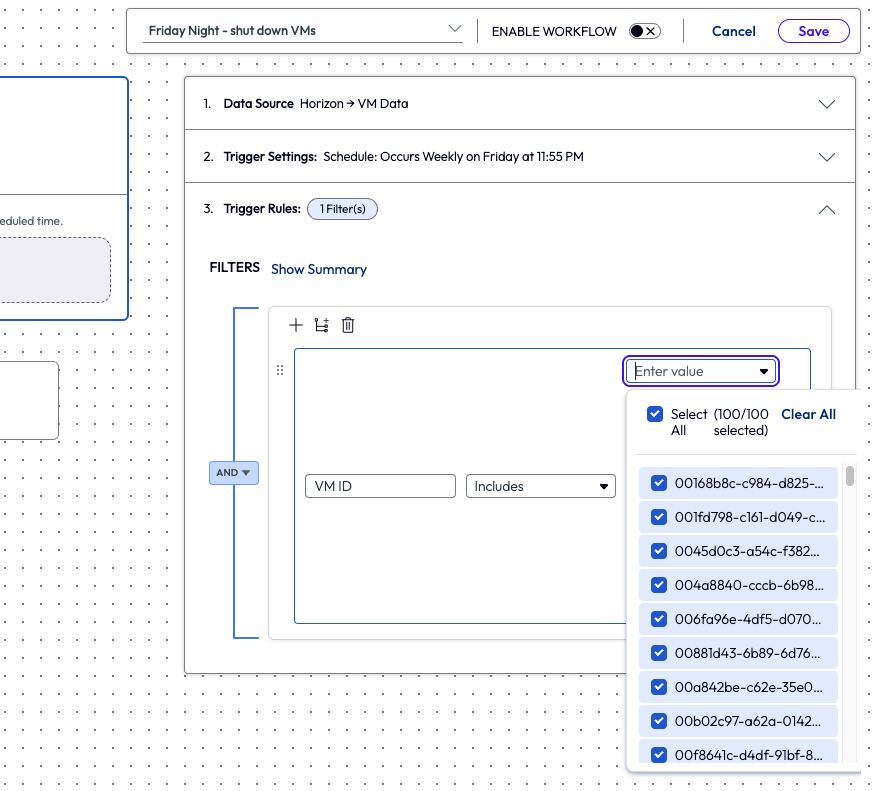
Figure 26: VM data source selected, VM ID attribute and 100 (all) VMs selected
This time the admin chose the workflow action named Power Off VM, which immediately stops the VM without graceful shutdown procedures.
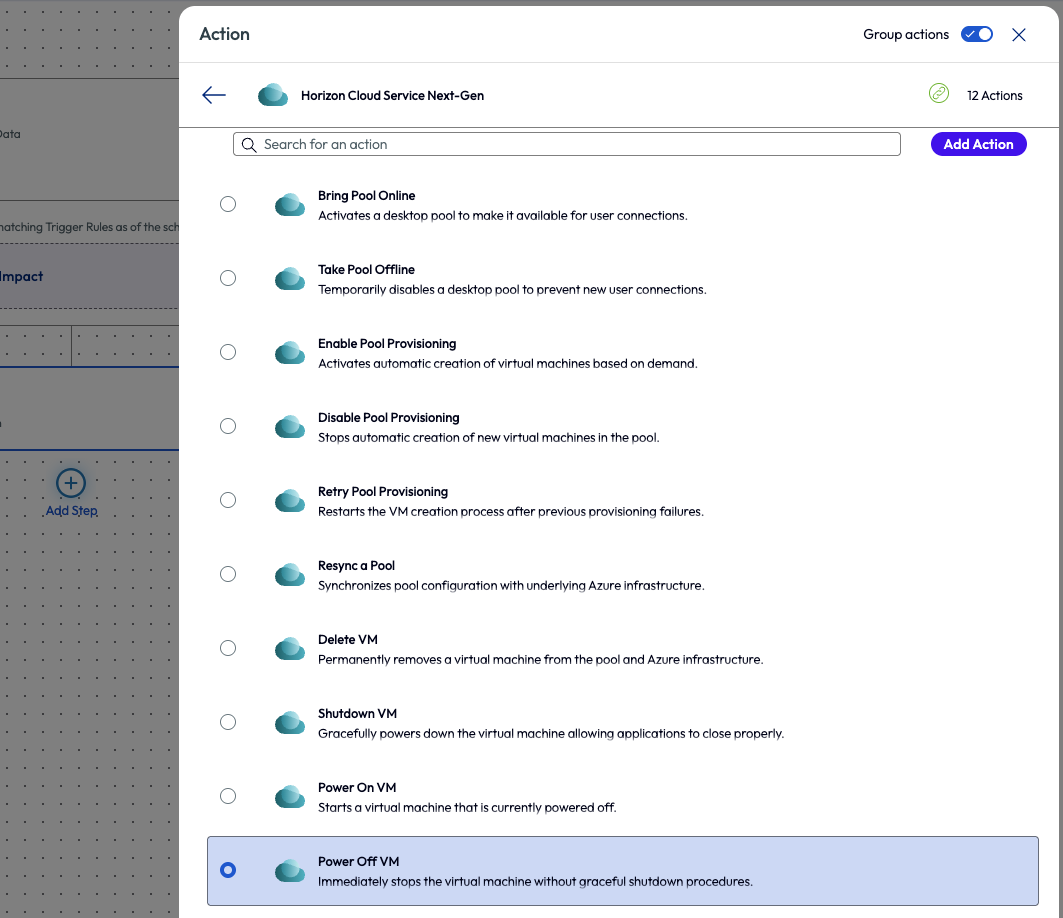
Figure 27: Horizon Cloud Service Next-Gen connector with Power Off VM action selected
With Friday night now automated, the admin addressed starting the pools and VMs for early Monday morning so that workers could get back to work within the organization’s working hours policy. For the first Monday morning workflow, the admin created a new workflow and chose the data source for VM Data. They named it Monday morning – power on VMs and then set the trigger schedule for weekly on Mondays at 5 minutes after midnight.
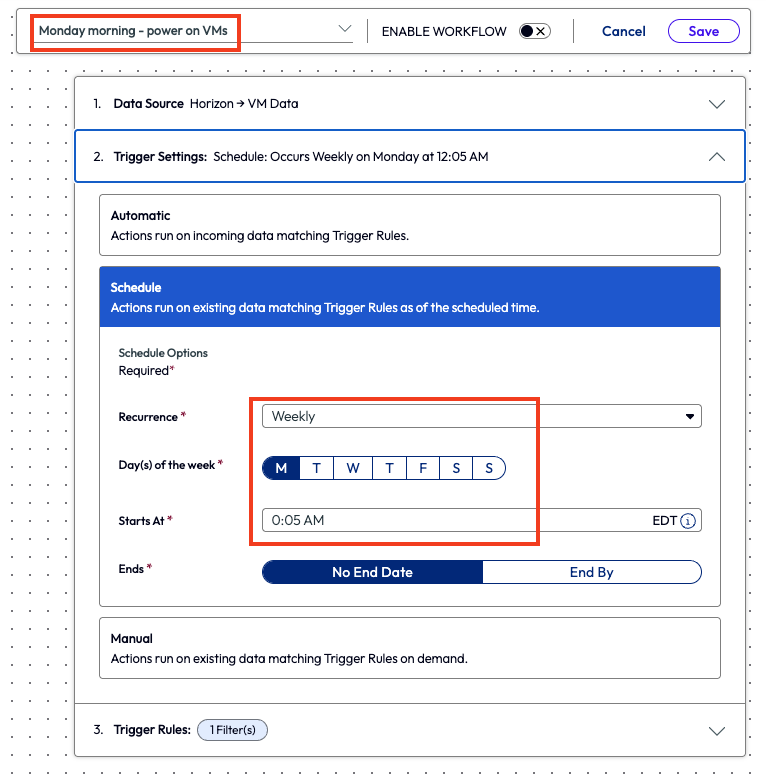
Figure 28: Workflow named Monday Morning – power on VMs with a schedule set for Monday mornings at 12:05am
The admin made the trigger rules match the previous workflow and selected all 100 VMs again. With this one done, they then created one last workflow to wrap up solving this weekend work issue. This final workflow, named Monday morning – bring pools online, used the Horizon Pool data once again and is scheduled 10 minutes after midnight on Monday morning to trigger the workflow. The same 27 pools were selected for the trigger rules and then an action step of Bring Pool Online was set. 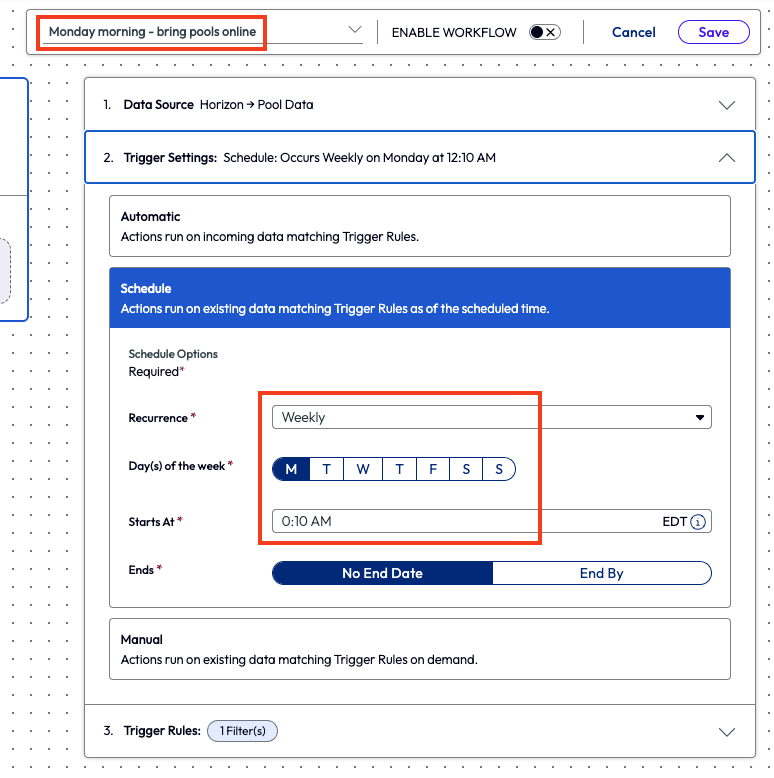
Figure 29: Named workflow and schedule set for 10 minutes after midnight on Monday morning
In figure 30, all four workflows are listed, and the flow of the process should make more sense here.
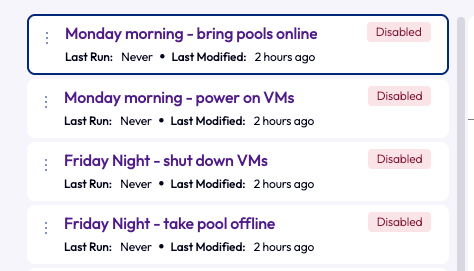
Figure 30: List of the 4 newly created workflows in order.
This use may have taken four different workflows to complete, but the few minutes it took to set these automations up will save hours of cumulated time in the future. Additionally, the original goal was accomplished in preventing remote workers from logging into VMs over the weekend and reducing overtime wages.
Use Case 5: Ticketing high connection server memory
Limited memory can lead to poor performance and other degrading issues, so obviously organizations keep a close eye on this metric. When a connection server runs low on memory, it can lead to poor experiences for multiple users. One particular organization had this happen to their environment within the past two months, and it caused a huge loss of time and productivity, so they upgraded the memory on the connection server. To monitor and prevent this from happening again, an admin built an automation to create a ticket for any time their connection server was running memory utilization higher than 80%. This may have seemed extreme at first, but the organization couldn’t afford more downtime.
Here’s how they prevented a stop-loss moving forward. The admin started by looking at the Horizon Operations Overview dashboard and saw a widget for Connection Server Memory Usage.
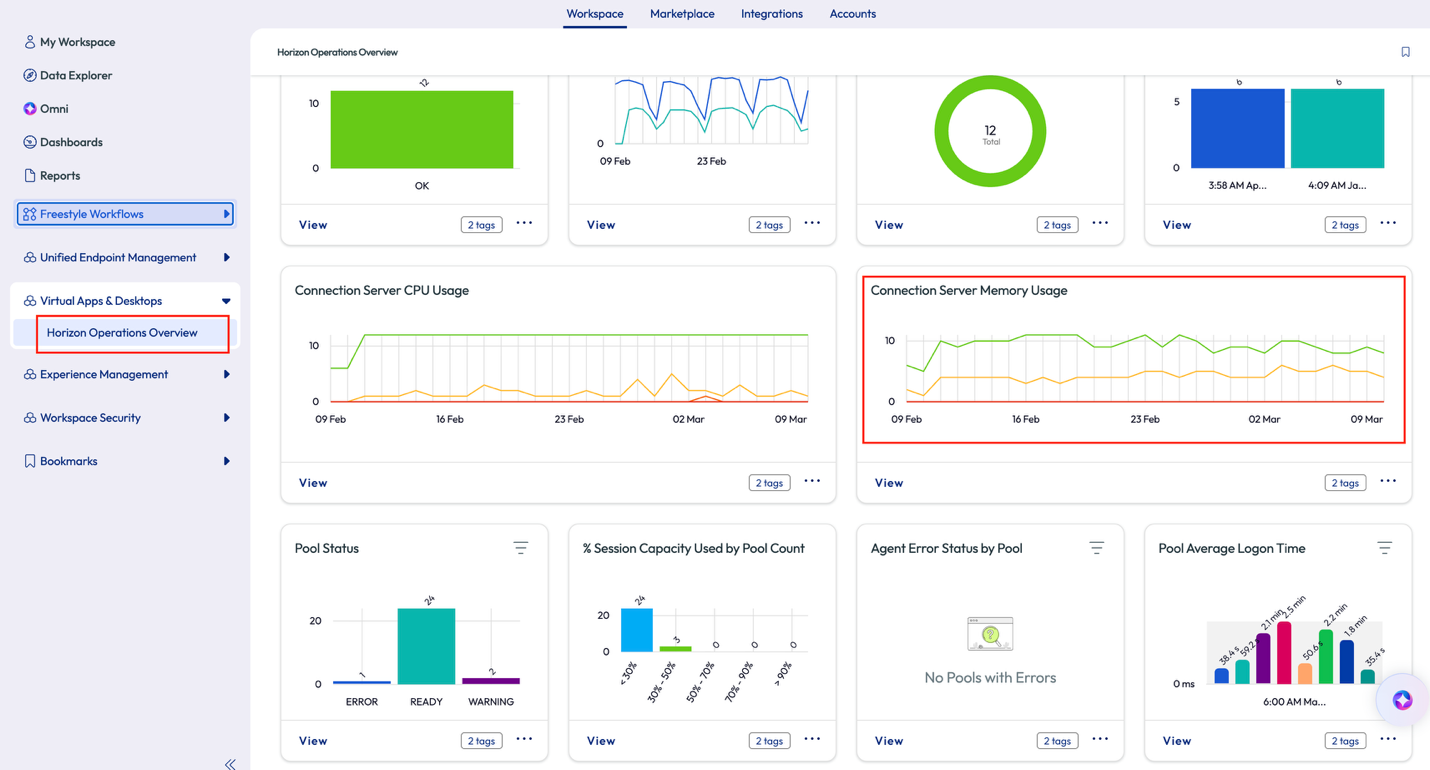
Figure 31: Horizon Operations Overview dashboard with Connection Server Memory Usage widget highlighted
The admin opened the widget to dig a bit deeper and filtered the chart and list by 70% - 90%, seen as label number 1 in figure 32. Thankfully, this chart showed no instances, item number 2 in figure 32, above 70% in the past 28 days, so the admin decided to create an alert for any occurrence above 80%.
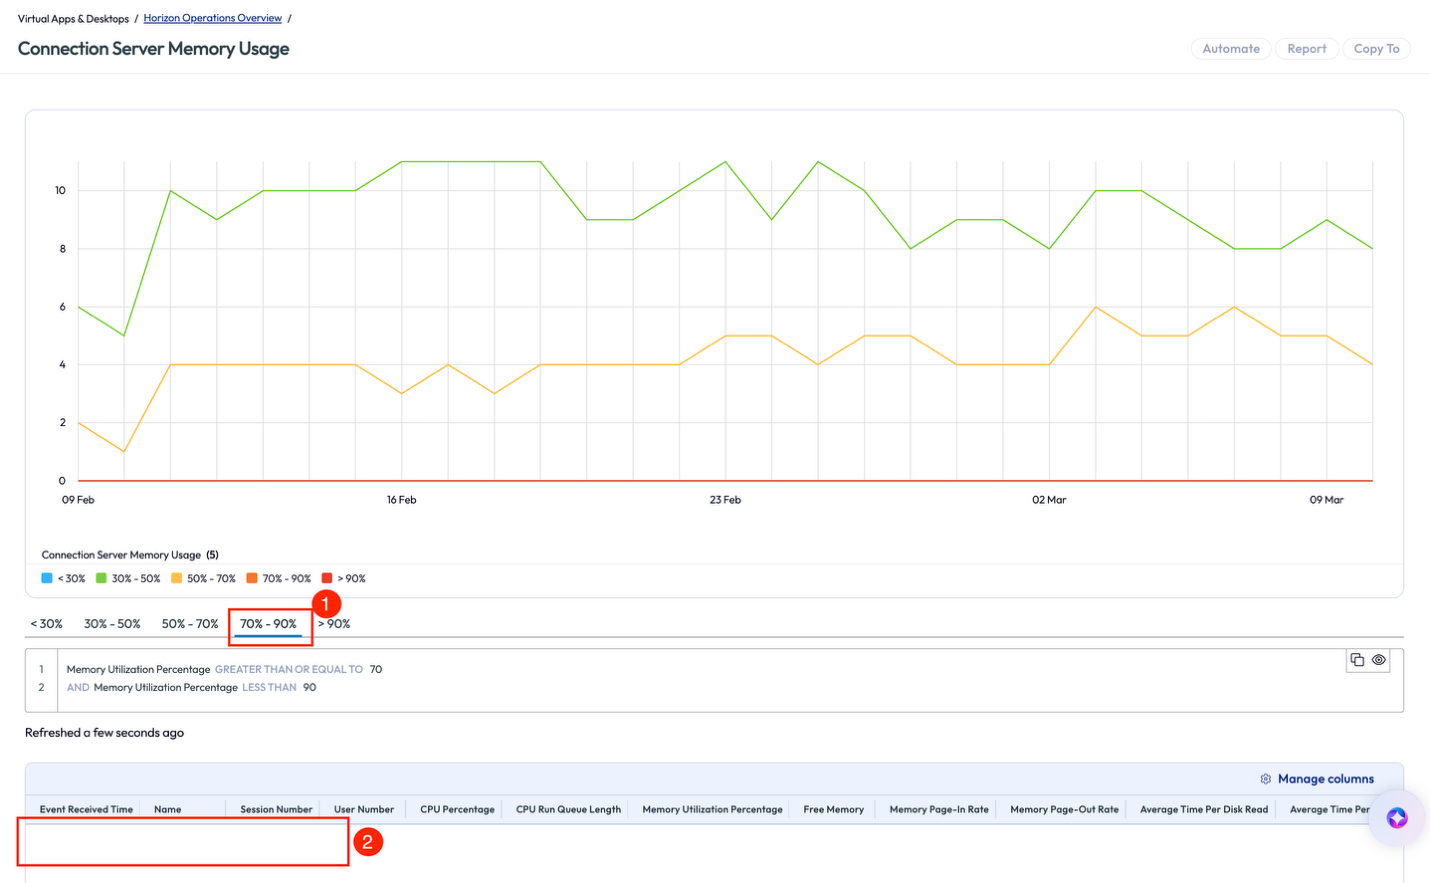
Figure 32: Connection Server Memory Usage widget with percentage range and blank results list highlighted
To accomplish this, the admin created a new workflow and named it Connection Server Memory Usage – High. They chose the Connection Server Statistics for the data source to pull metrics.
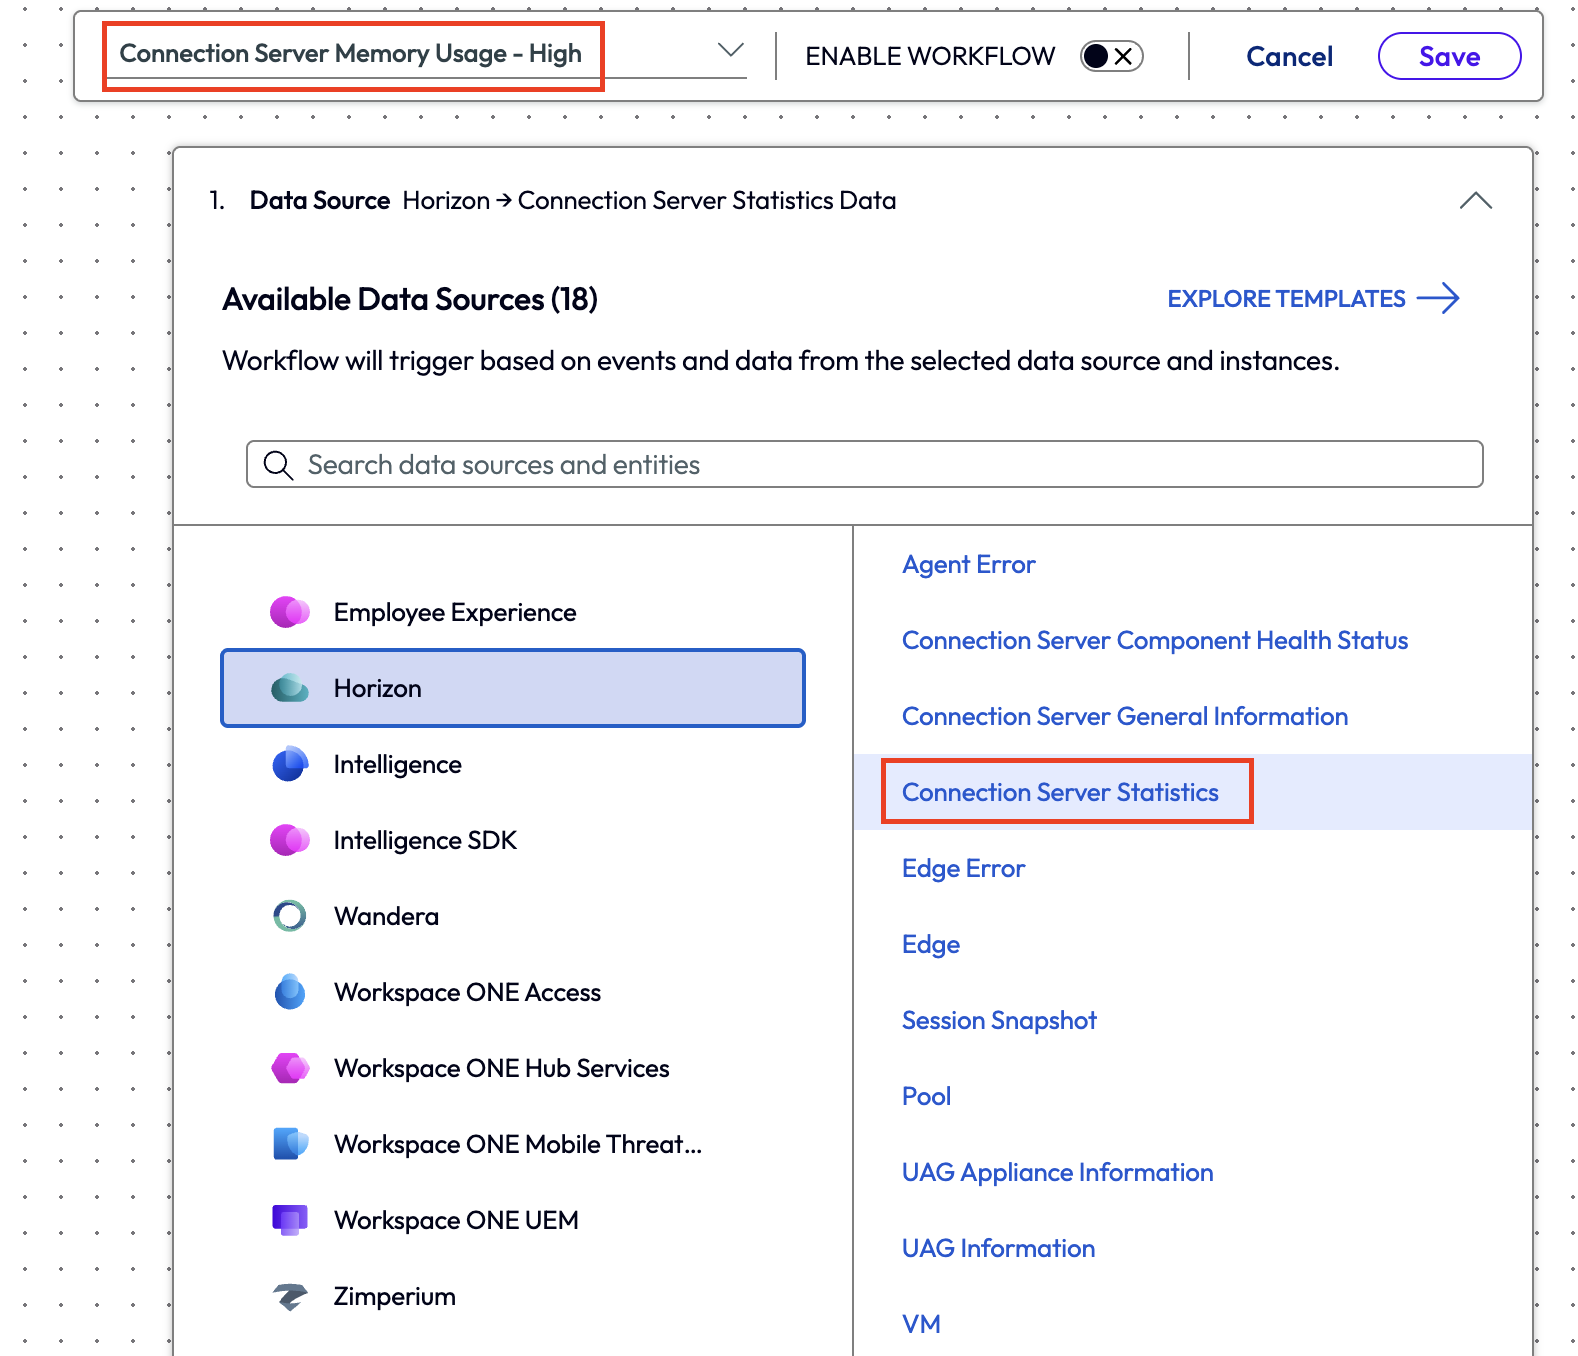
Figure 33: Selecting Connection Server Statistics as the data source under the Horizon category.
After setting the Trigger Settings to automatic, the admin filtered the data by only reporting a Memory Utilization Percentage greater than or equal to 80%.
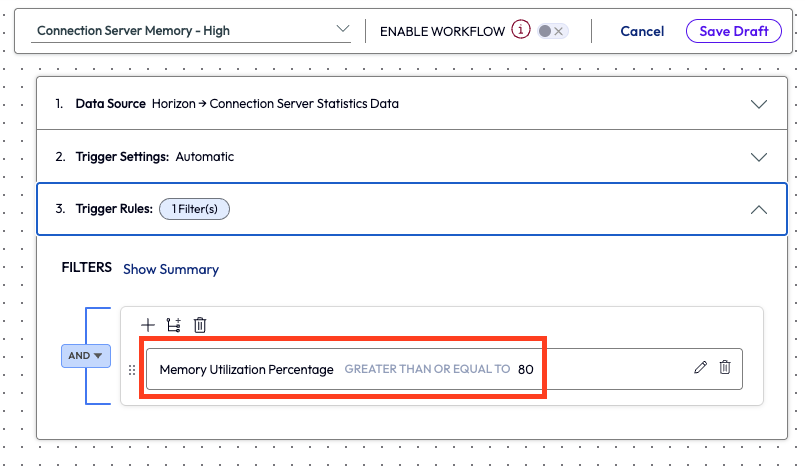
Figure 34: Filter set at greater than or equal to 80% for Memory Utilization Percentage
The next step was easy; the admin simply added an action to create a SNOW ticket for the event.
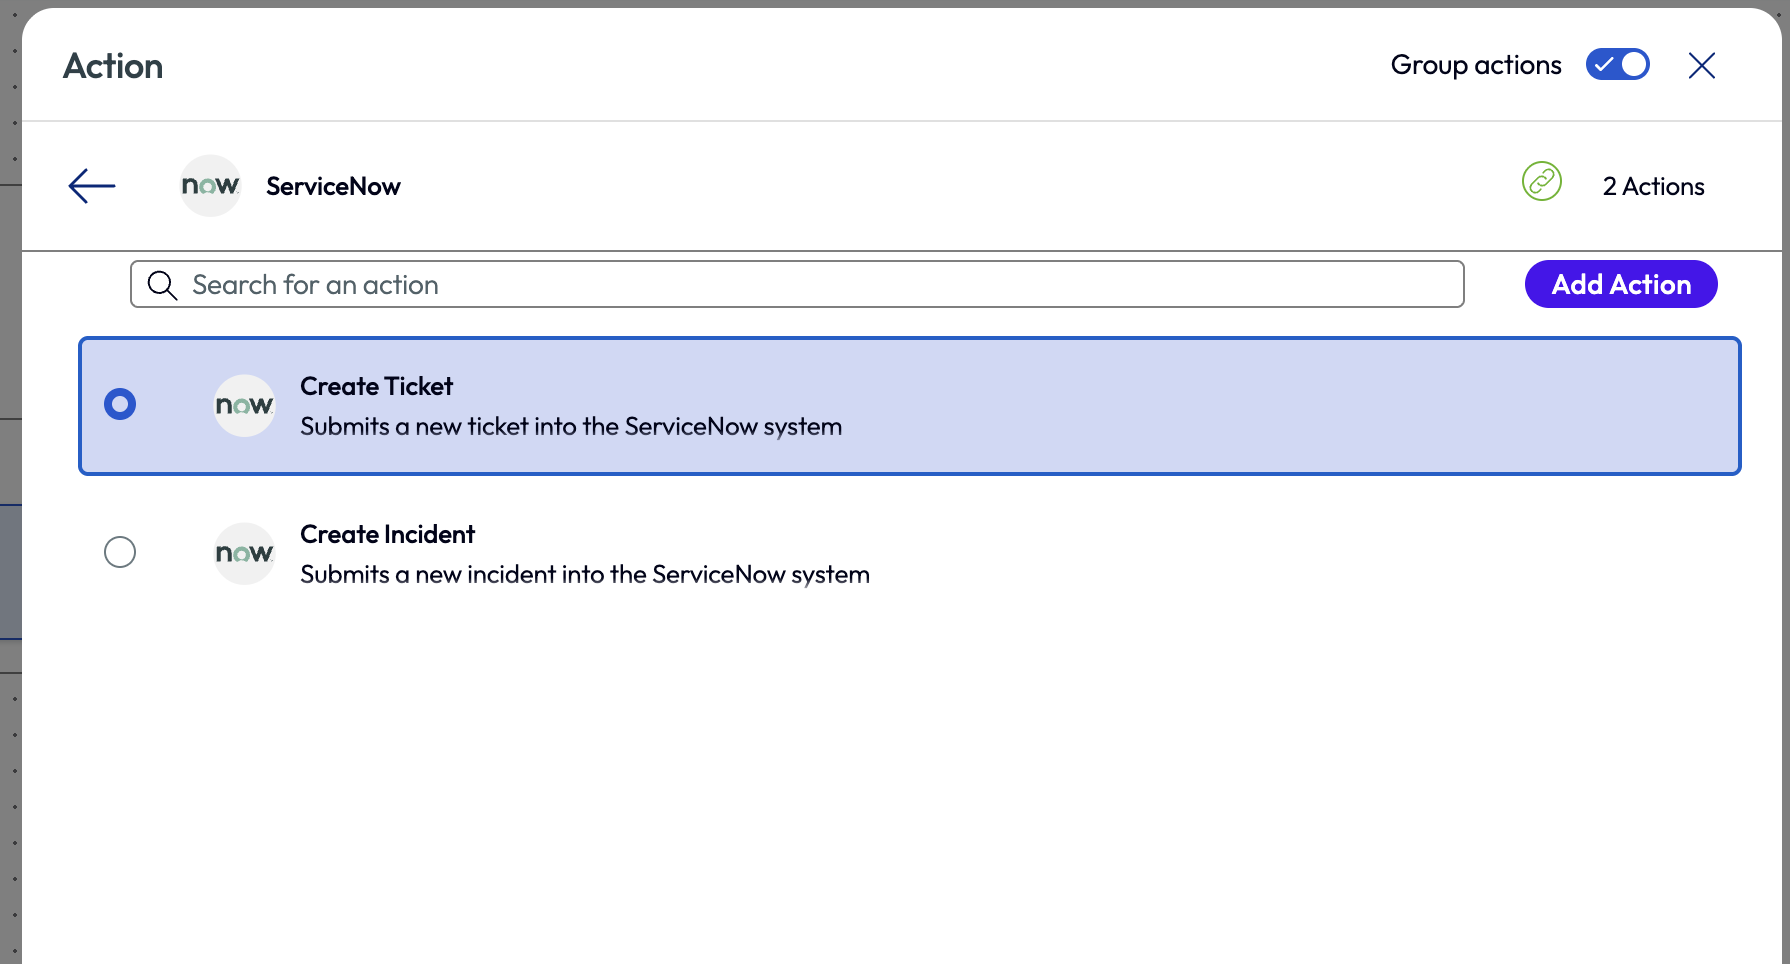
Figure 35: Action step to create a new SNOW ticket within an automation
Moving forward, when a connection server memory had 20% or less memory at any given point, a SNOW ticket would be created, and the appropriate team would work to investigate and resolve the issue.
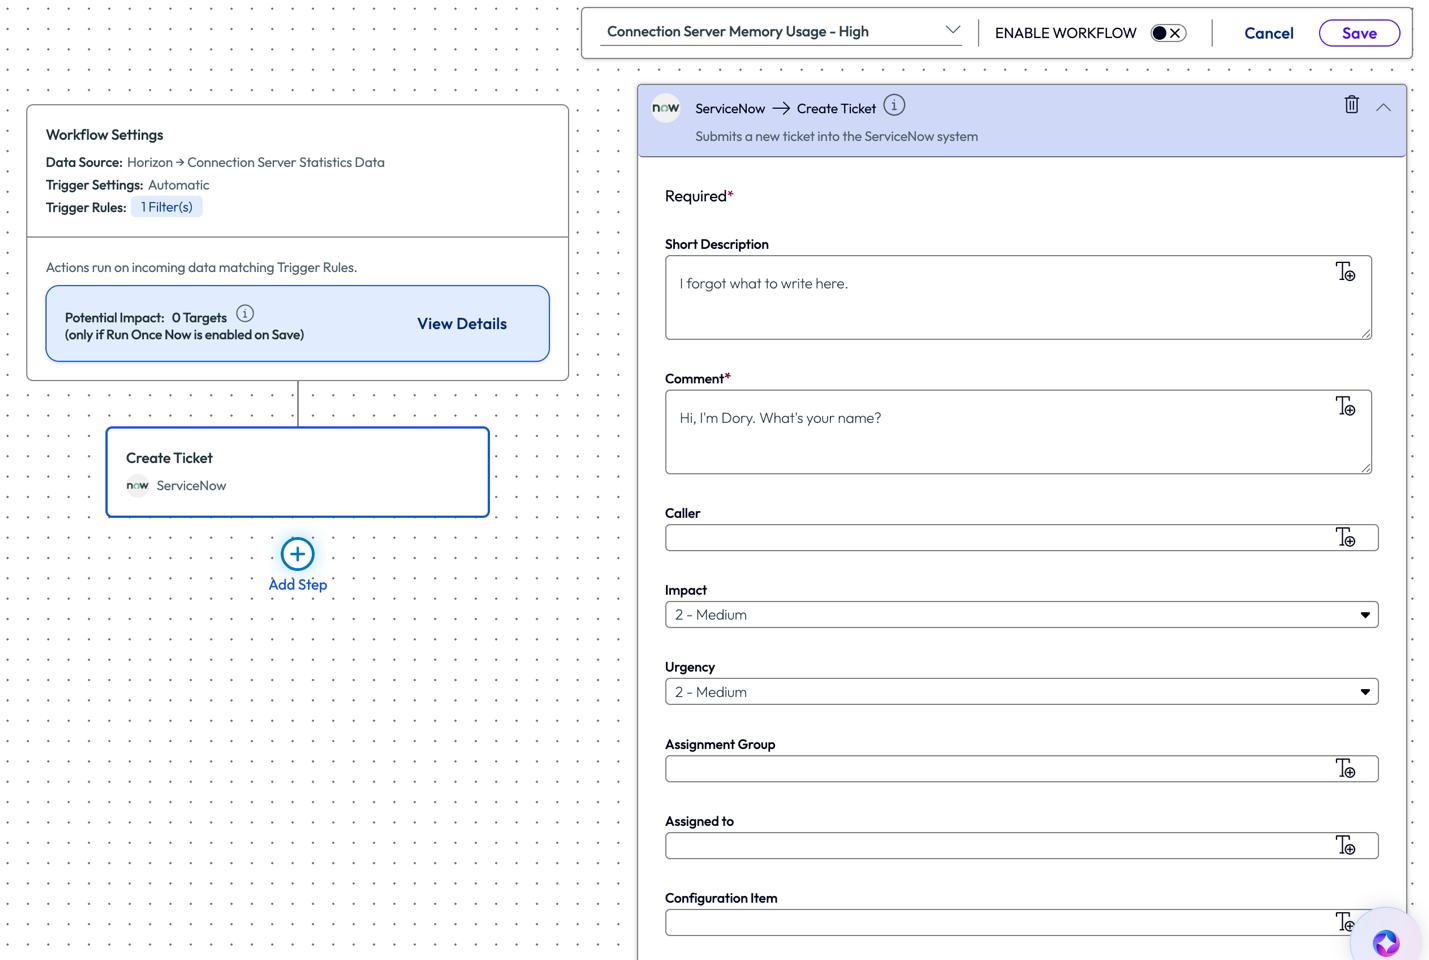
Figure 36: SNOW ticket creation page within a workflow
The organization would now know exactly when the issue occurred and have a team investigate the issue almost immediately. Automating ticket creation was not reactive in the sense of waiting for users to complain, but rather immediate because as the issue occurred, it can be addressed. Again, this is a simple example, but the logic can be applied to a myriad of similar use cases to monitor. Setting up an alert for a CPU spike may not be ideal, but there are cases like this one where alerts and tickets do make sense for organizations that have mission critical processes in place.
Use Case 6: Alerting on poor level health of active sessions over 24 hours
This use case follows an online retail organization that has remote employees. These employees were instructed to disconnect their sessions at the end of the workday because the support teams had found performance issues with active sessions that were connected for extended periods of time. However, not all the employees were following this policy. An admin came up with an idea to have the system alert for any session that had a health status of Warning or Critical and had an active session for more than 24 hours.
The admin started this automatic alerting by creating a new workflow and chose the Session Snapshot data source from the Horizon category.
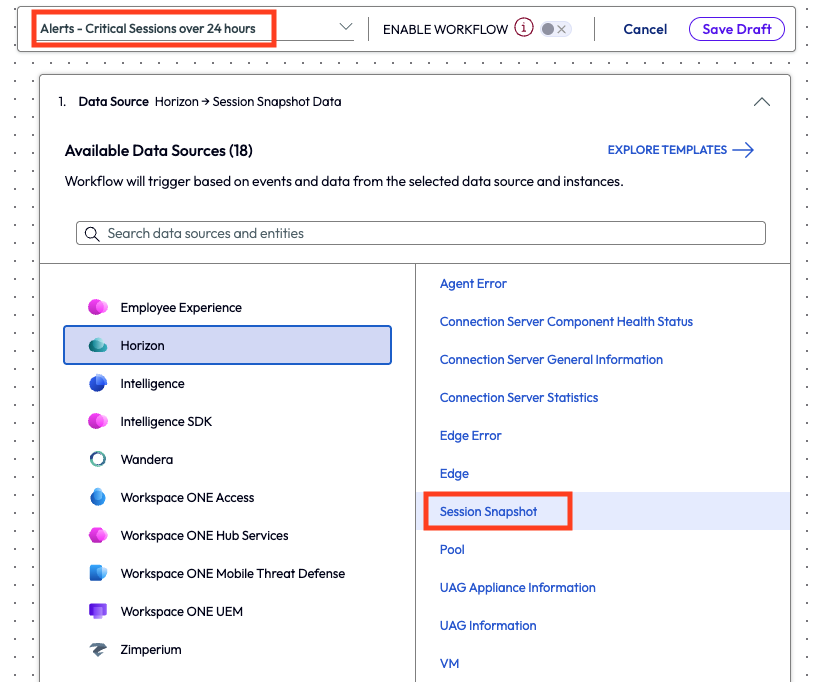
Figure 37: New workflow with name and data source highlighted
Trigger results were set to Active Session Duration of greater than or equal to 86,400 seconds, or 24 hours. Additionally, the admin used the Session Health Status to include Critical and Warning values, which helped narrow down the impacted sessions.
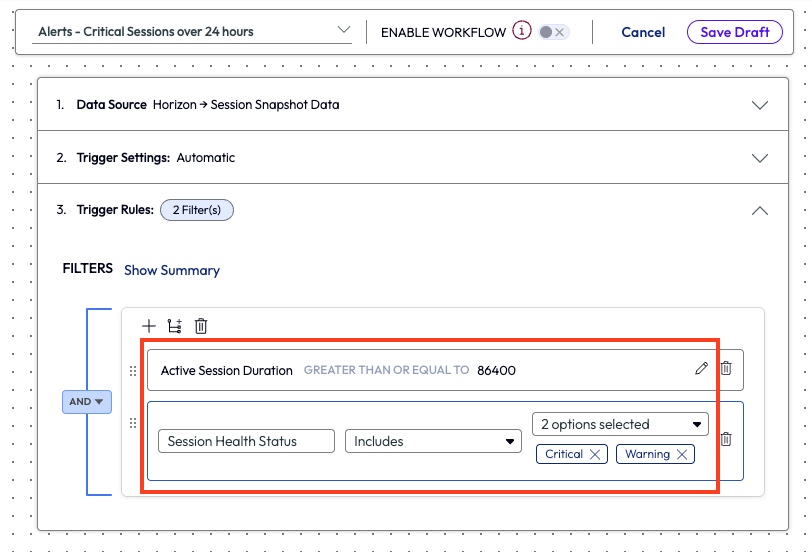
Figure 38: Filters with selected values within a workflow.
The final step was to add an action that sent an instant message via Slack to an appropriately monitor channel.
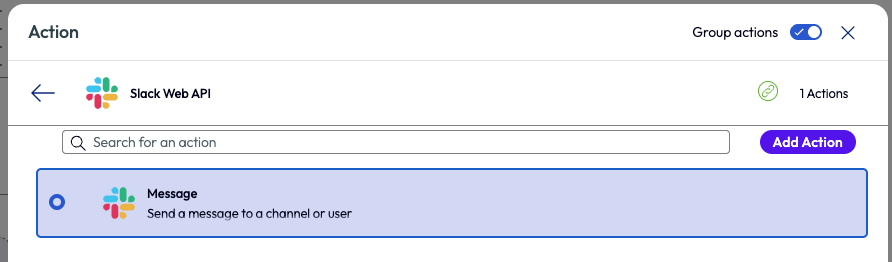
Figure 39: Action of sending a message selected for the Slack Web API.
The admin set the parameters for the message and saved the workflow. With this completed, the support teams could investigate any sessions that meet these criteria and start to troubleshoot quicker.
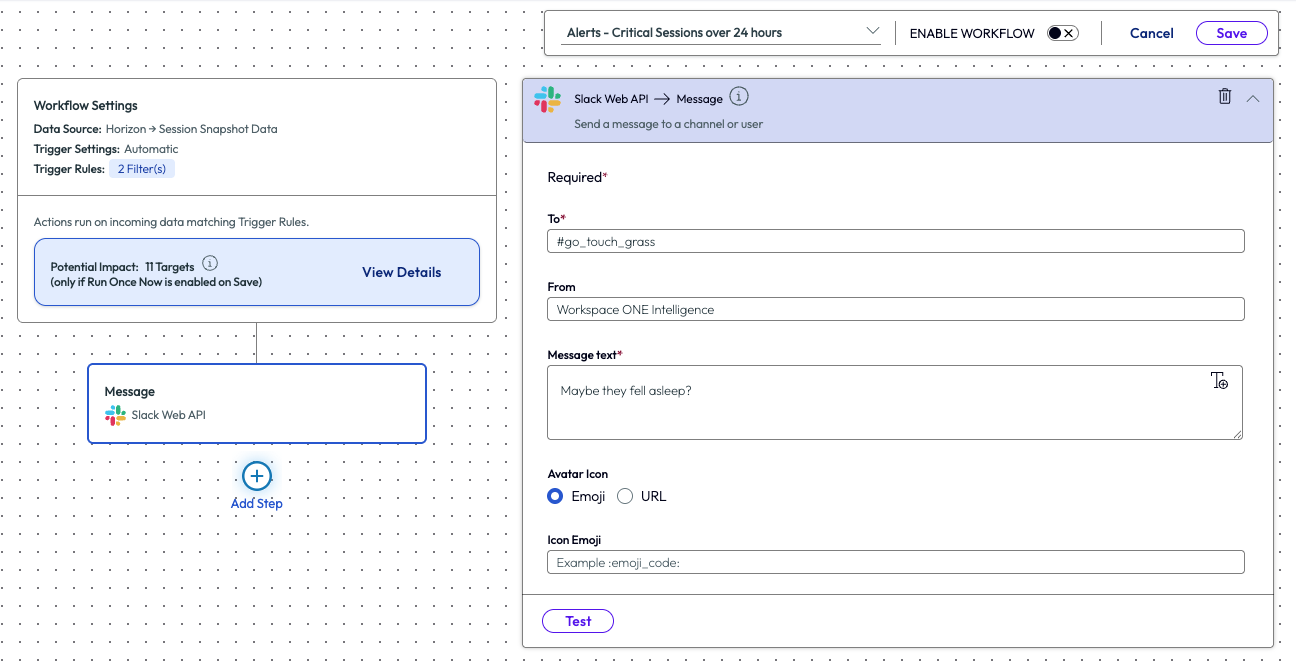
Figure 40: Text fields and parameters for sending a message via Slack Web API.
This simple use case will help support teams stay one step ahead of this issue. Improvement on the Mean Time to Resolution (MTTR) was seen by leadership as an important ROI factor and as an increase in productivity.
Wrap up
This document highlights some of the most common challenges faced by Horizon admins today and should help brainstorm other ideas or methods to solve issues specific to organizations. Experience Management is a tool that illuminates the data that organizations didn’t know needed illuminating, but the impressive piece is being able to act on the data and remediate much quicker than before.
Feedback
We value any and all feedback.
To comment on this paper, contact the Omnissa Product Specialist Team at tech_content_feedback@omnissa.com.